A sudden spike in SHIB burn rate often leads to upward pressure on its price. The principle is straightforward: shrinking supply combined with steady or rising demand generally drives an asset’s value higher.
Currently, SHIB holds a market capitalization of $7.2 billion, while its 24-hour trading volume is 15% down at $152 million, yet to capitalize on the burn activity.
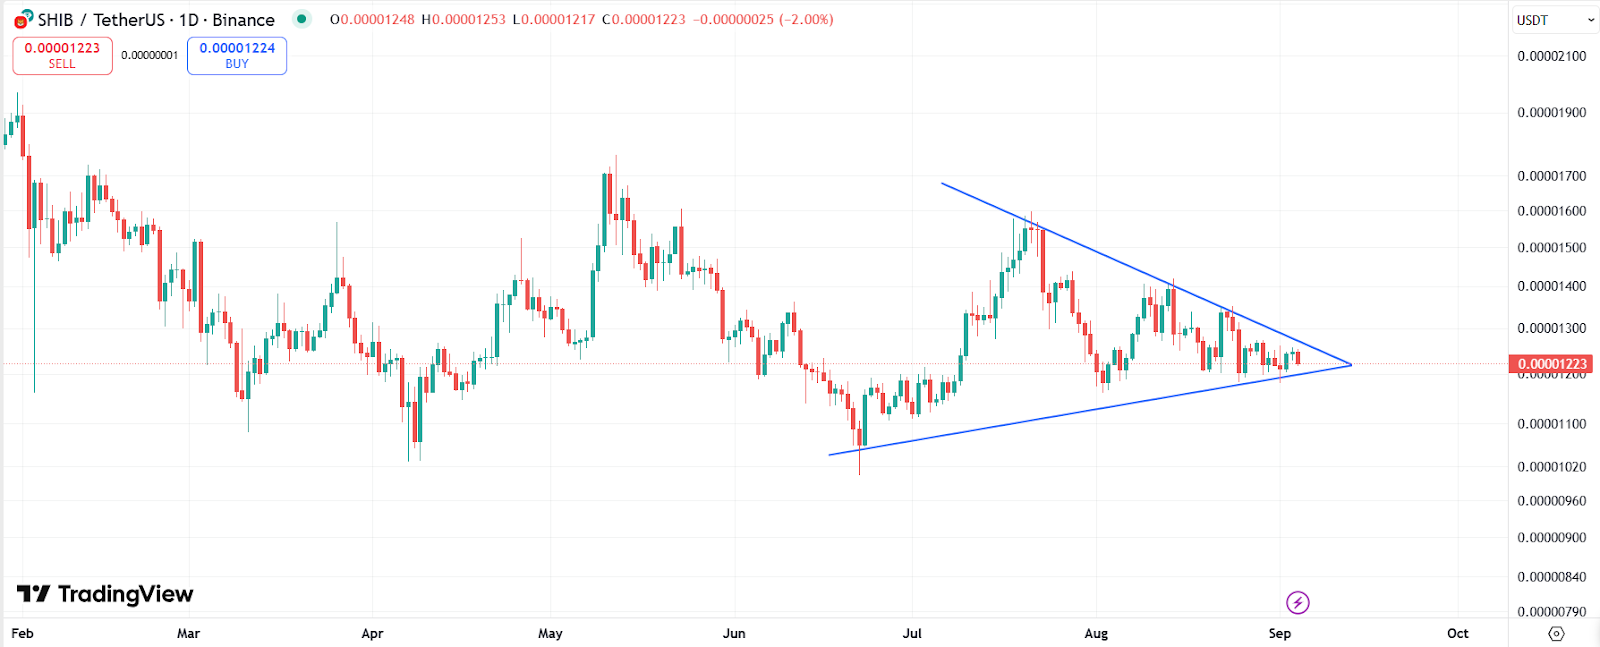
Imminent SHIB Price Breakout Ahead?
On the daily chart, the top meme coin has been consolidating inside a symmetrical triangle since mid-July. This pattern often leads to a breakout, with price compression hinting at growing volatility ahead.
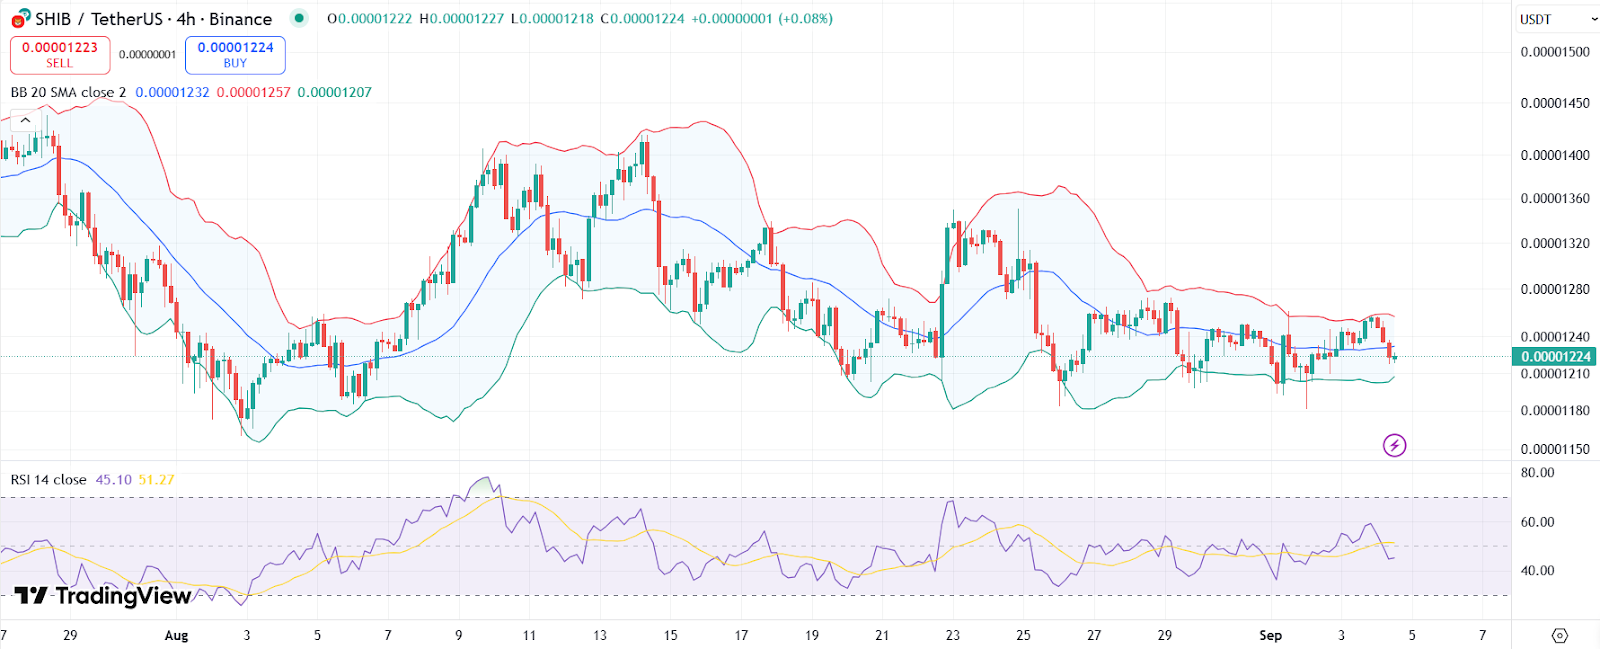
On the 4-hour SHIB price chart, the Bollinger Bands are tightening, signaling a potential breakout in either direction.
Currently, price hovers near the middle band (20-day SMA), suggesting indecision among traders.
SHIB 4-hour price chart with the RSI and Bollinger Bands. | Source: TradingView
Meanwhile, the RSI is also sitting in neutral territory, leaving room for strong moves both ways. If the indicator pushes above 55, a bullish scenario could send SHIB to reclaim resistance at $0.0000128 and $0.0000135.
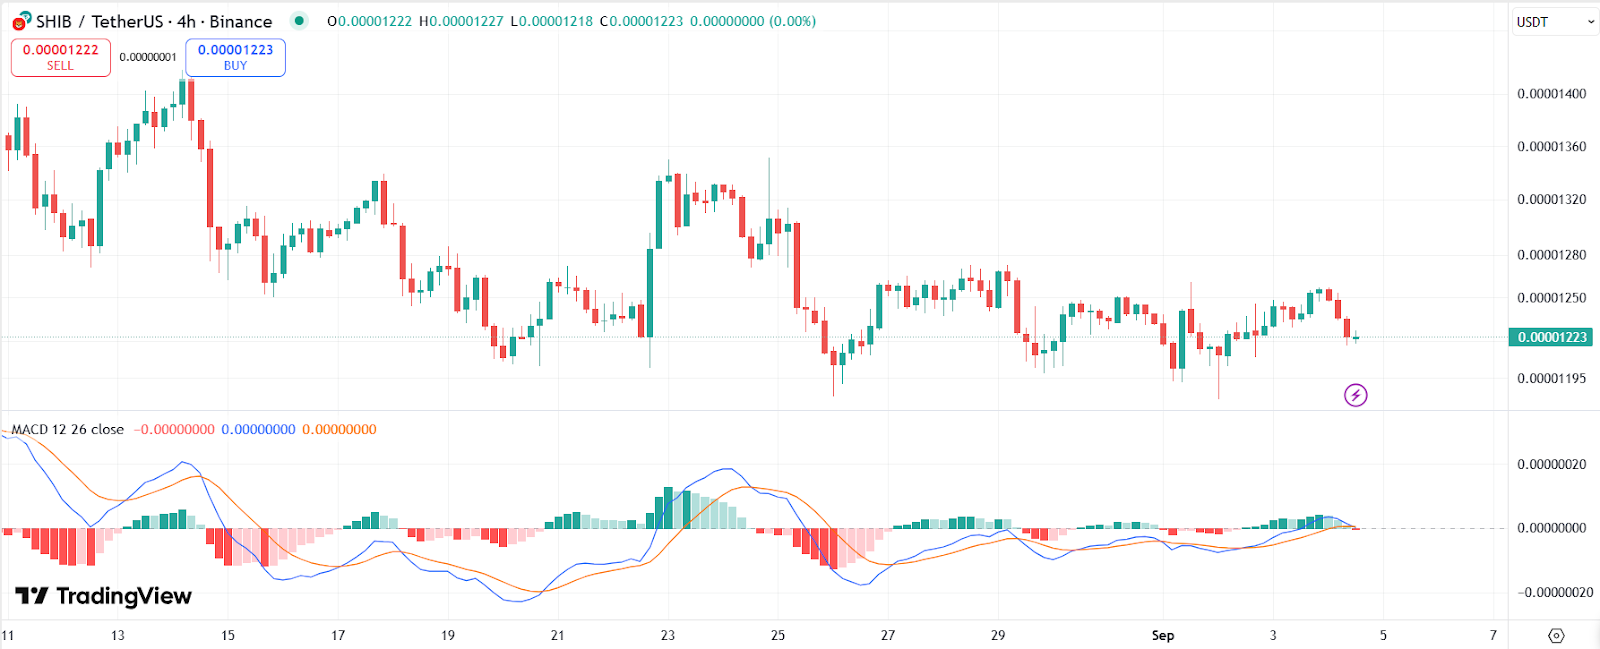
Meanwhile, the MACD indicator shows narrowing histogram bars with the signal line crossing close to the baseline.
This setup often results in a momentum shift. Traders should watch key support levels around $0.0000120 and $0.0000115.
SHIB 4-hour price chart with the MACD. | Source: TradingView
Disclaimer: Coinspeaker is committed to providing unbiased and transparent reporting. This article aims to deliver accurate and timely information but should not be taken as financial or investment advice. Since market conditions can change rapidly, we encourage you to verify information on your own and consult with a professional before making any decisions based on this content.
A crypto journalist with over 5 years of experience in the industry, Parth has worked with major media outlets in the crypto and finance world, gathering experience and expertise in the space after surviving bear and bull markets over the years. Parth is also an author of 4 self-published books.