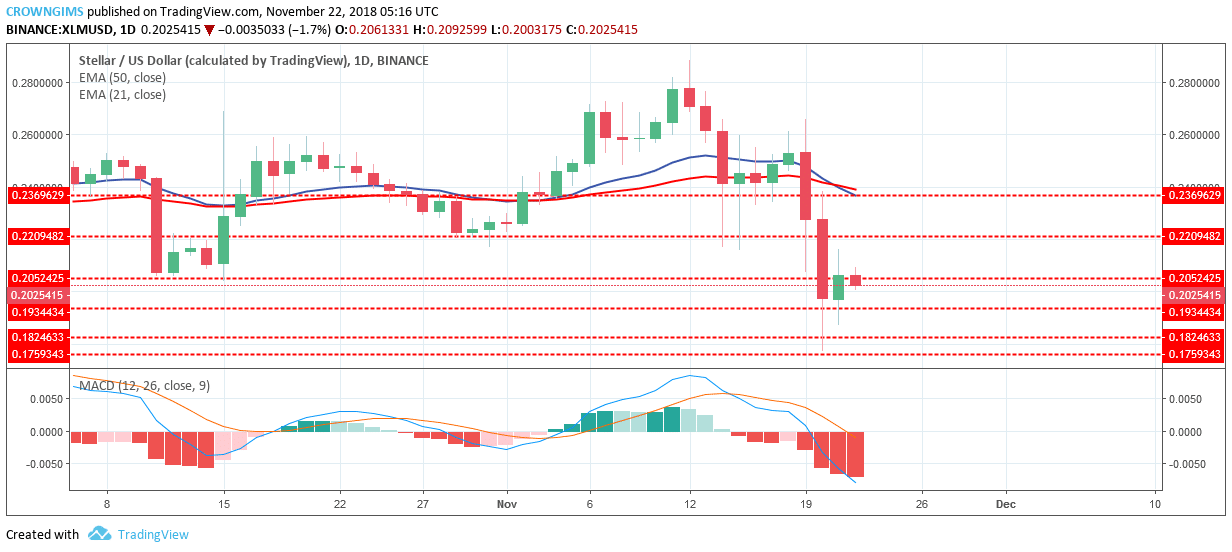
Supply levels: $0.20, $0.22, $0.23
Demand levels: $0.19, $0.18, $0.17XLM is still bearish on its long-term outlook. The cryptocurrency reached a height of $0.25 Stellar price level last week. The Bulls lost the pressure and bearish engulfing candle formed on November 19 signaled the high momentum of the bears. The bears took control over the market, pushed the XLM price down to the extent of broken the former demand levels of $0.23, $0.22, $0.20 downside to the previous low of $0.17 demand level area. The Bulls defended the demand level of $0.17 and pushed it up to $0.20 price level.
Currently, the market is forming another bearish candle inside a bullish bar which implies a further decrease of Stellar price. The 21-day EMA crossed 50-day EMA downside indicate a bearish movement in the market. XLM price is below the two EMAs with distance away from each other connotes the bearish pressure in the XLM market is strong. In addition, the MACD period 12 with its histogram is below zero level with its signal lines pointing downward which indicates a strong selling signal.
XLM/USD Price Medium-term Trend: Bearish
XLM is in its bearish trend on the 4-Hour chart. As long as the XLM price remains under the dynamic support and resistant of 21-day EMA and 50-day EMA with the former crossed the later downside, the bearish movement of the coin is ongoing. On the 4-Hour chart, the coin pulled back from its low of $0.18 to the $0.22 to retest the broken level and the trend continues.
XLM price is currently below $0.20 demand level exposed to the demand level of $0.19. In case the demand level of $0.19 holds the price may bounce and the bulls may reverse the trend. However, MACD with its histogram is below zero level with its signal lines about crossing each other upside which indicates that the bulls may take over the market soon.
Azeez Mustapha is a specialist in Computer Studies (including DTP), Forex and Crypto trading professional. Being expert technical and currency analyst, as well as experienced fund manager and author of several books, Azeez places strong focus on crypto market studies conducting comprehensive price analyses and sharing forecasts of presumptive market trends.
 XLM is still bearish on its long-term outlook. The cryptocurrency reached a height of $0.25 Stellar price level last week. The Bulls lost the pressure and bearish engulfing candle formed on November 19 signaled the high momentum of the bears. The bears took control over the market, pushed the XLM price down to the extent of broken the former demand levels of $0.23, $0.22, $0.20 downside to the previous low of $0.17 demand level area. The Bulls defended the demand level of $0.17 and pushed it up to $0.20 price level.
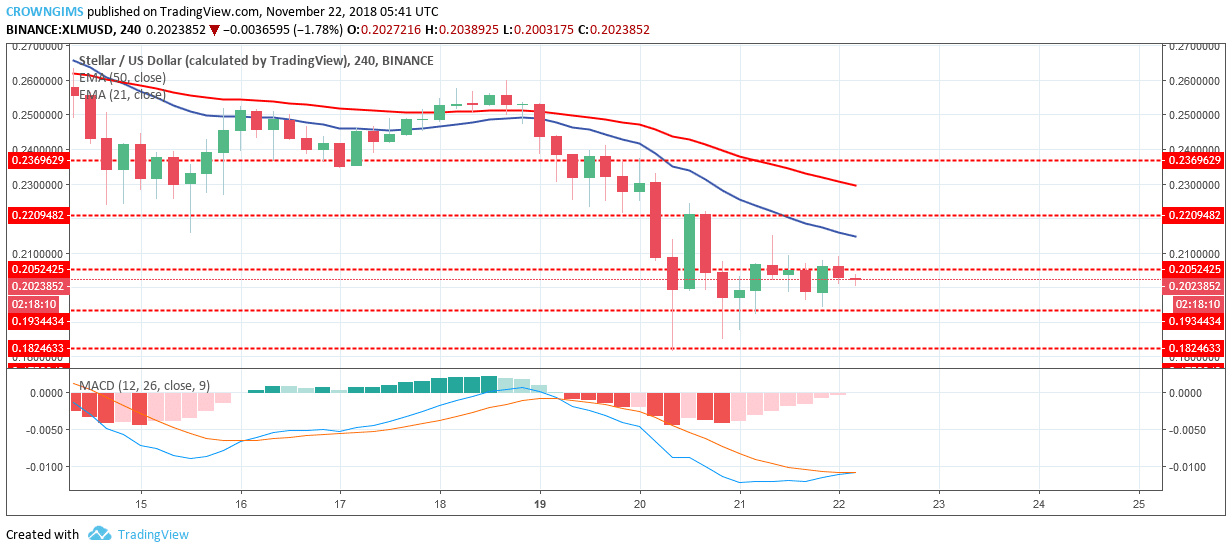 XLM is in its bearish trend on the 4-Hour chart. As long as the XLM price remains under the dynamic support and resistant of 21-day EMA and 50-day EMA with the former crossed the later downside, the bearish movement of the coin is ongoing. On the 4-Hour chart, the coin pulled back from its low of $0.18 to the $0.22 to retest the broken level and the trend continues.