Stellar Price Analysis: XLM/USD Trends of February 07–13, 2019
Downtrend will continue in case the bears were able to break down the demand level of $0.07, then, Stellar price will have its low at $0.06 price level. On the other hand, should the demand level of $0.07 holds the bulls may take over the XLM market.
By Azeez Mustapha
Updated
2 mins readPhoto: QuoteInspector
Key Highlights:
The Bears were still in control of the Stellar market;
the downtrend may continue in case $0.07 price level is broken down;
there could be price reversal soon.
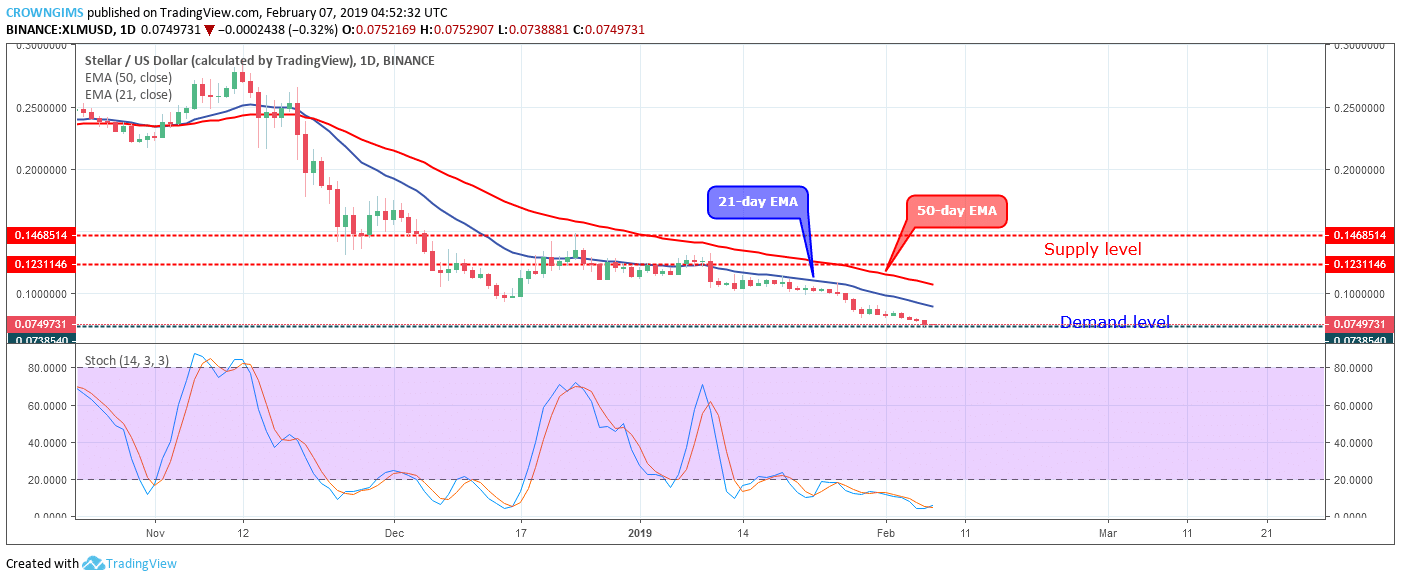
XLM/USD Price Long-term Trend: Bearish
Supply levels: $0.09, $0.10, $0.12
Demand levels: $0.07, $0.06, $0.05XLM/USD sustains its bearish trend on the long-term outlook. Bears still held tight to the XLM market and the XLM price steadily declined towards the demand level of $0.07 lower price than the previous low. The coin could not break down the $0.07 price level last week. Stellar price is on the support level of $0.07 price level.
The two EMAs were well separated from one another, sloppy down with the XLM price trading below the 21-day EMA and 50-day EMA which is an indication of a bearish trend in the XLM market. More bearish candles were coming up which implies that the bearish trend may continue.
However, the Stochastic Oscillator period 14 is at the oversold level ( below 20 levels) and its signal lines about turning up the side which indicates that the buyers may come into the XLM market soon with full force and drive Stellar price upside.
Downtrend will continue in case the bears were able to break down the demand level of $0.07, then, the XLM price will have its low at $0.06 price level. On the other hand, should the demand level of $0.07 holds the bulls may take over the XLM market.
XLM/USD Price Medium-term Trend: Bearish
On the 4-Hour chart, XLM/USD is on its bearish trend. Stellar price maintains its bearish pressure which started on January 10 and the bears dominate the XLM market since then with little or no interruption from the bulls. There was a bullish pullback on January 31, which almost break up the two dynamic support and resistance but later rejected by the bears and the cryptos continued its bearish trend making lower lows on the 4-hour chart.
Stellar price continues its trading below the 21-day EMA and 50-day EMA which indicates a continuation of bearish momentum. Meanwhile, the Stochastic Oscillator period 14 is at 20 levels with its signal lines pointing upside which indicates buy signal.
Azeez Mustapha is a specialist in Computer Studies (including DTP), Forex and Crypto trading professional. Being expert technical and currency analyst, as well as experienced fund manager and author of several books, Azeez places strong focus on crypto market studies conducting comprehensive price analyses and sharing forecasts of presumptive market trends.

 XLM/USD sustains its bearish trend on the long-term outlook. Bears still held tight to the XLM market and the XLM price steadily declined towards the demand level of $0.07 lower price than the previous low. The coin could not break down the $0.07 price level last week. Stellar price is on the support level of $0.07 price level.
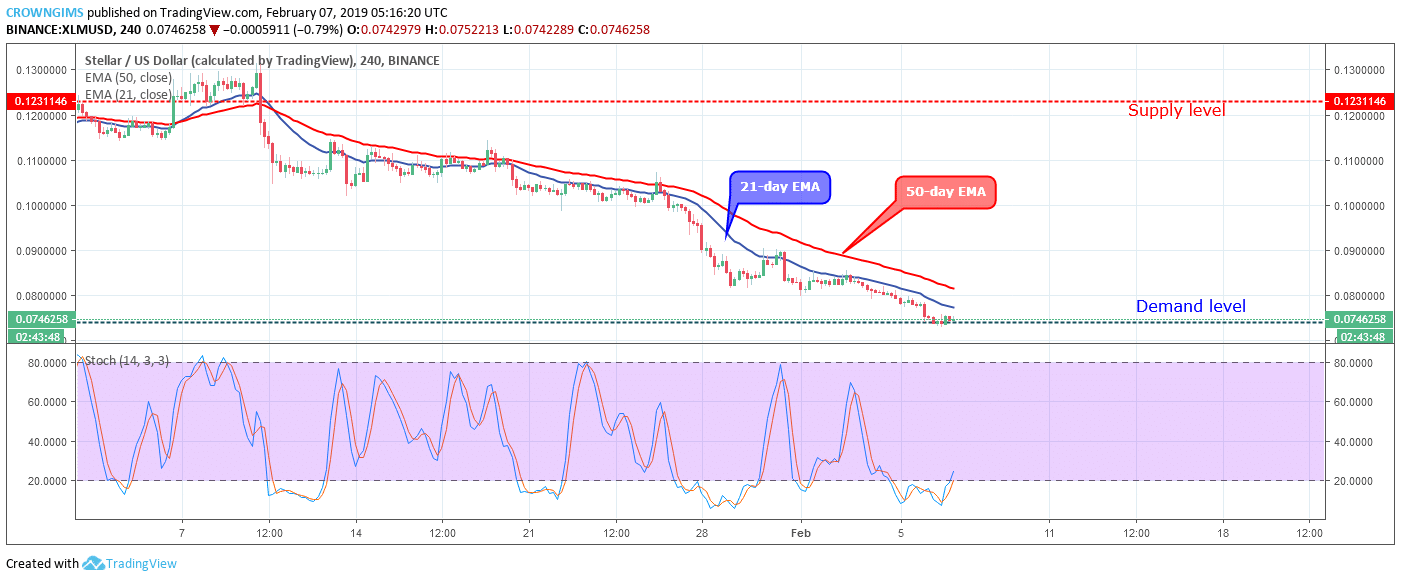 On the 4-Hour chart, XLM/USD is on its bearish trend. Stellar price maintains its bearish pressure which started on January 10 and the bears dominate the XLM market since then with little or no interruption from the bulls. There was a bullish pullback on January 31, which almost break up the two dynamic support and resistance but later rejected by the bears and the cryptos continued its bearish trend making lower lows on the 4-hour chart.