Tron (TRX) Price Analysis: Trends of October 16–22, 2018
In case bears increase their momentum there is a probability that the price will experience downtrend movement below the support level of $0.025.
By Azeez Mustapha
Updated
2 mins readPhoto: Shutterstock
Key Highlights:
There is a tendency for price reduction;
a breakdown of the price below the support level of $0.025;
there is a probability for further increase of the price.
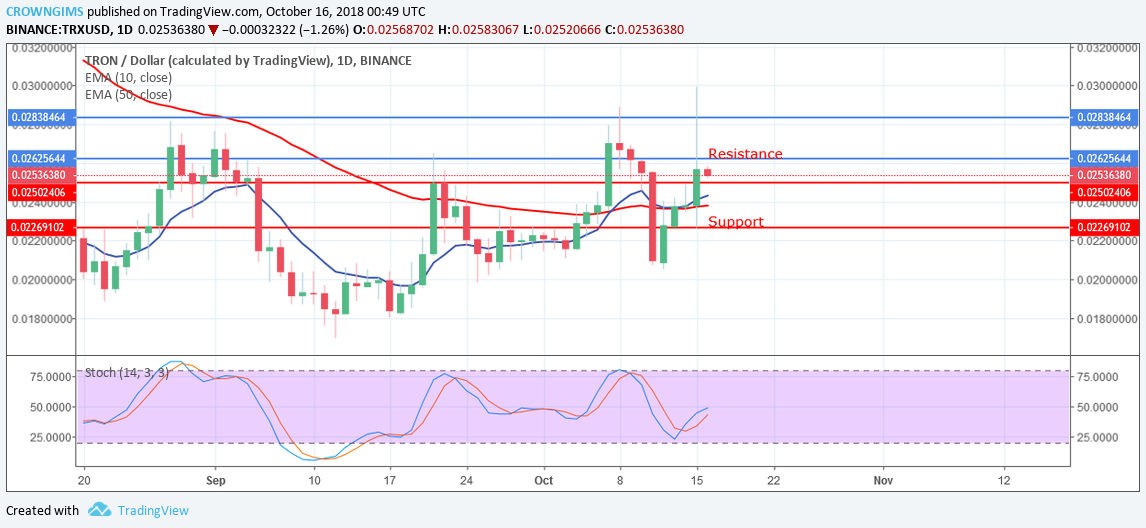
TRX/USD Long-term Trend: Bullish
Resistance levels: $0.026, $0.028, $0.031
Support levels: $0.025, $0.022, $0.020TRX/USD continues its uptrend movement in its daily chart last week. On October 11, the bears pushed the coin to the support level of $0.022 and it was rejected by the formation of bullish inside bar candles which brought about the influx of the bulls into the market and the coin experienced rapid uptrend movement to the upper resistance level of $0.030. The Bulls lost the pressure and the market reversed to the support level of 0.025 with the high momentum of the bears; this confirmed with the formation of upper long wick candles.
Currently, the price is retesting the resistance level of $0.025. The coin is above the 10-day EMA and the 50-day EMA is below the 10-day EMA; which means there is a probability for further increase of the price from the support level of $0.025. In case the support level does not hold, there may be a break out to the lower support level of $0.025.
The Stochastic Oscillator Period 14 on the daily chart is above the 25 level with the signal lines pointing to the north, indicating that price may increase.
TRX/USD Price Medium-term Trend: Bullish
On the 4-Hour chart, the coin is also bullish last week. The formation of bullish pin bar on the support level of $0.022 brings in more Bulls into the market with their full force and brought a sudden increase of the price. The price headed towards the upper resistance level of $0.030 last week. The bears came in and gradually push the coin downward.
As at now, the bulls are in control of the market as TRX is above 10-day EMA and the 50-day EMA; it indicates a continuation of uptrend movement.
In case bears increase their momentum there is a probability that the price will experience downtrend movement below the support level of $0.025. Nonetheless, the Stochastic Oscillator Period 14 is below 50 levels with the signal lines directed towards the south indicates a sell signal.
Azeez Mustapha is a specialist in Computer Studies (including DTP), Forex and Crypto trading professional. Being expert technical and currency analyst, as well as experienced fund manager and author of several books, Azeez places strong focus on crypto market studies conducting comprehensive price analyses and sharing forecasts of presumptive market trends.

 TRX/USD continues its uptrend movement in its daily chart last week. On October 11, the bears pushed the coin to the support level of $0.022 and it was rejected by the formation of bullish inside bar candles which brought about the influx of the bulls into the market and the coin experienced rapid uptrend movement to the upper resistance level of $0.030. The Bulls lost the pressure and the market reversed to the support level of 0.025 with the high momentum of the bears; this confirmed with the formation of upper long wick candles.
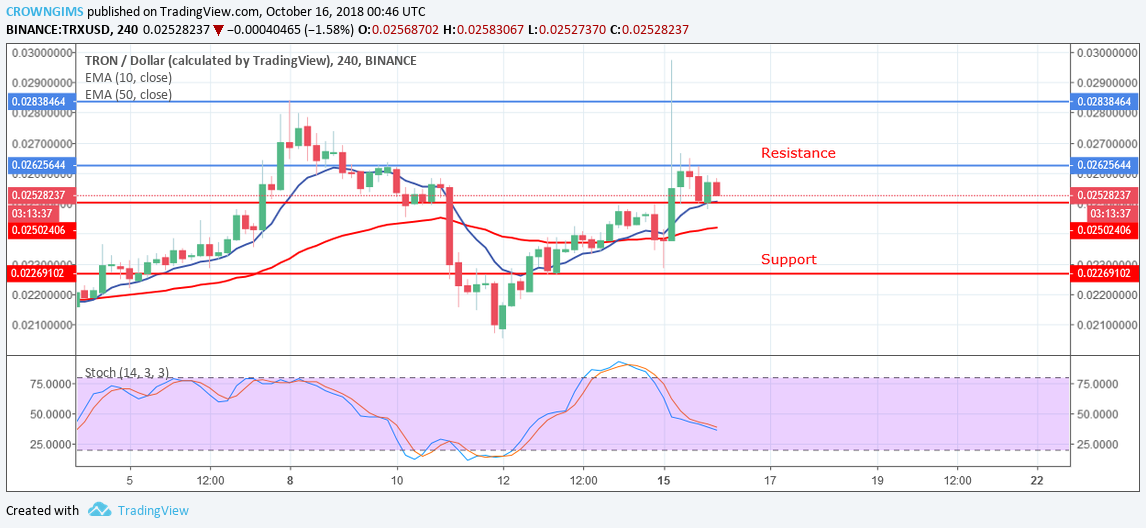 On the 4-Hour chart, the coin is also bullish last week. The formation of bullish pin bar on the support level of $0.022 brings in more Bulls into the market with their full force and brought a sudden increase of the price. The price headed towards the upper resistance level of $0.030 last week. The bears came in and gradually push the coin downward.