Should buyers increase their momentum price will rally to the north;
bears are in control of the market,
in case support level of $0.05 hold, the price will increase;
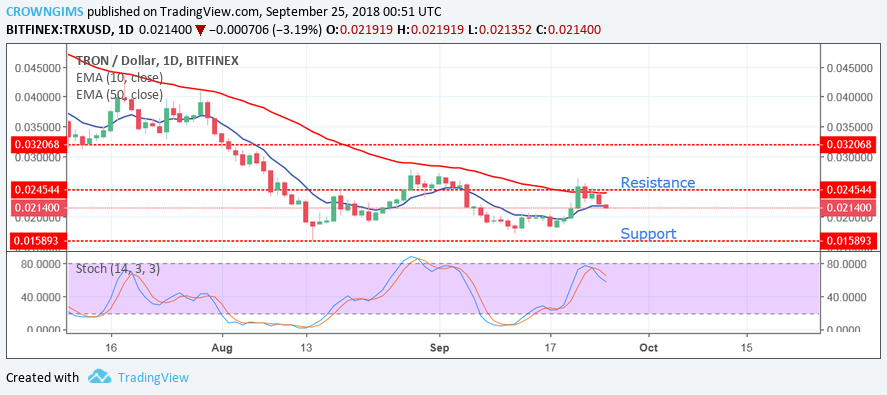
TRX/USD Long-term Trend: Bearish
Resistance levels: $0.024, $0.031, $0.041
Support levels: $0.015, $0.010, $0.05The coin moved upward last week towards the resistance levels of $0.024 with the formation of bullish inside bar candle at the support level of $0.010.The buyers were unable to push the price higher above the resistance level of $0.024. The price fell due to the bearish pressure towards the support level of $0.015. Some bearish candles were formed with further reduction in the price last week.
The price is below both 10-day EMA and 50-day EMA. There is a probability for further reduction of the price towards the support level of $0.015 this week. In case bears put in more pressure, the support level of $0.015 may not hold and the support level of $0.010 will be exposed.
Should the support level of $0.015 holds, the price might go up within the next several trading days, by making a break out towards the North at $0.024. The Stochastic Oscillator Period 14 on the daily chart is above level 70 with the signal lines pointing towards the south, indicating that there could be further bearish movement this week.
TRX/USD Price Medium-term Trend: Bearish
The pressure from the bulls pushed the TRX/USD up towards the resistance level of $0.024 last week as more buyers came in but there was not enough momentum to break the resistance upward. The cryptocurrency on the medium-term outlook still bearish as the 10-day EMA crossed the 50-day EMA downside with the price below 10-day EMA; it indicates that there could be a downtrend movement towards the support level of $0.015.
Should buyers increases their momentum this week there is a probability that the price will experience uptrend movement towards the resistance level of $0.024.Nevertheless, the Stochastic Oscillator Period 14 is above 20 level, with the signal lines directed towards the south indicate a sell signal.
Azeez Mustapha is a specialist in Computer Studies (including DTP), Forex and Crypto trading professional. Being expert technical and currency analyst, as well as experienced fund manager and author of several books, Azeez places strong focus on crypto market studies conducting comprehensive price analyses and sharing forecasts of presumptive market trends.

 The coin moved upward last week towards the resistance levels of $0.024 with the formation of bullish inside bar candle at the support level of $0.010.The buyers were unable to push the price higher above the resistance level of $0.024. The price fell due to the bearish pressure towards the support level of $0.015. Some bearish candles were formed with further reduction in the price last week.
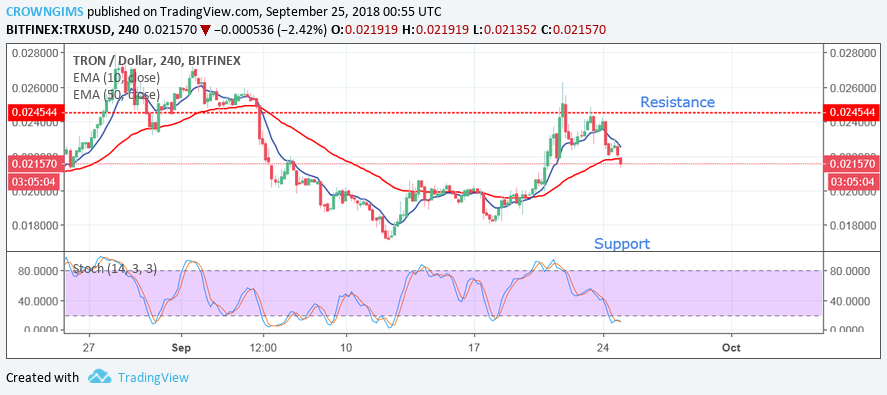 The pressure from the bulls pushed the TRX/USD up towards the resistance level of $0.024 last week as more buyers came in but there was not enough momentum to break the resistance upward. The cryptocurrency on the medium-term outlook still bearish as the 10-day EMA crossed the 50-day EMA downside with the price below 10-day EMA; it indicates that there could be a downtrend movement towards the support level of $0.015.