Death cross in EMAs signals potential continuation of bearish momentum in Arbitrum prices.
Fibonacci projections indicate $1 psychological target on a breakout rally.
Strong demand zone at $0.62–$0.65 holds 7.04M ARB tokens, aiding bullish recovery.
With the crypto market gradually turning bearish, the total crypto market cap excluding Bitcoin BTC$66 03324h volatility:0.6%Market cap:$1.32 TVol. 24h:$30.00 B
is down to $1.43 trillion. This records a massive drop of 5.66% from $1.53 trillion yesterday. Amid the pullback, Arbitrum is holding at a crucial support level, with buyers hoping for a comeback. The broader market pullback warns of an intense correction.
Arbitrum Tests Crucial Support at $0.66
In the daily chart, the ARB price ARB$0.085924h volatility:4.0%Market cap:$537.14 MVol. 24h:$47.79 M
action reveals a local resistance trendline, keeping the bullish growth under check. With the lower-high formation, the ARB price finds strong support near the $0.665 mark.
The support level has provided a bullish reversal twice in the past 30 days. Currently, Arbitrum trades at a price of $0.6870, with a 24-hour low at $0.6701. This reveals a lower price rejection from the crucial support level.
Furthermore, the daily RSI line reveals a bullish divergence in the past two bottom formations. This increases the chances of an uptrend, with which ARB could re-challenge the local trendline.
However, the growing bearish influence has resulted in a bearish crossover between the 50 and 200 EMA lines. This marks a death cross event and increases the chances of a downtrend continuation.
Considering the broader market stabilizes, a bullish comeback in Arbitrum could break above the resistance trendline. Using the trend-based Fibonacci levels, the trendline breakout rally is expected to reach the $1 psychological mark near the 50% level.
Optimistically, the price targets extend to $1.7984 or the 100% Fibonacci level. On the flip side, a bearish continuation will challenge the crucial support at $0.58 or $0.4724.
On-Chain Data Supports Bullish Comeback Chances
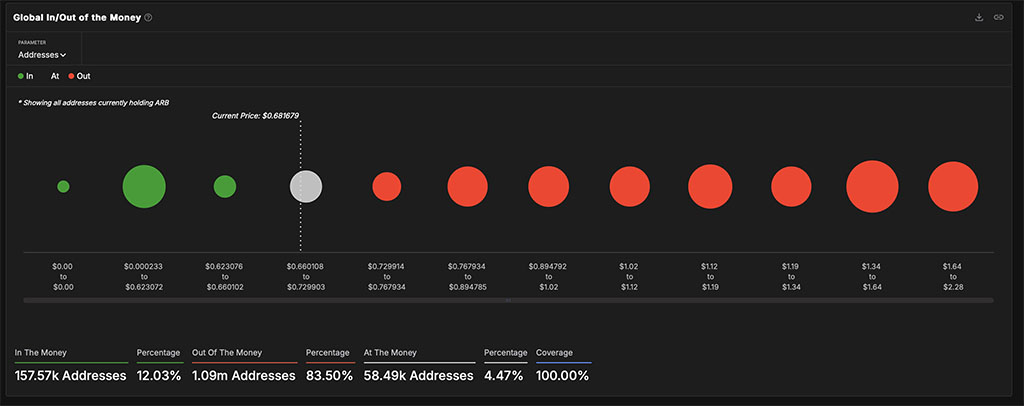
Amid the ongoing pullback, the Global In-and-Out-of-the-Money indicator from IntoTheBlock showcases the At-the-Money Zone as a crucial crossroad. Currently, the At-the-Money Zone holds 4.12 million ARB tokens.
However, the growing selling pressure is likely to test the next crucial support zone, extending between $0.62 and $0.65. This zone holds 7.04 million ARB tokens within 367 addresses, marking a solid demand zone that could help Arbitrum regain a bullish stance.
Currently, the Global In-and-Out-of-the-Money indicator reveals 4.97K addresses holding nearly 17 million ARB tokens in the money.
Analyst Projects 46% Swing in Arbitrum
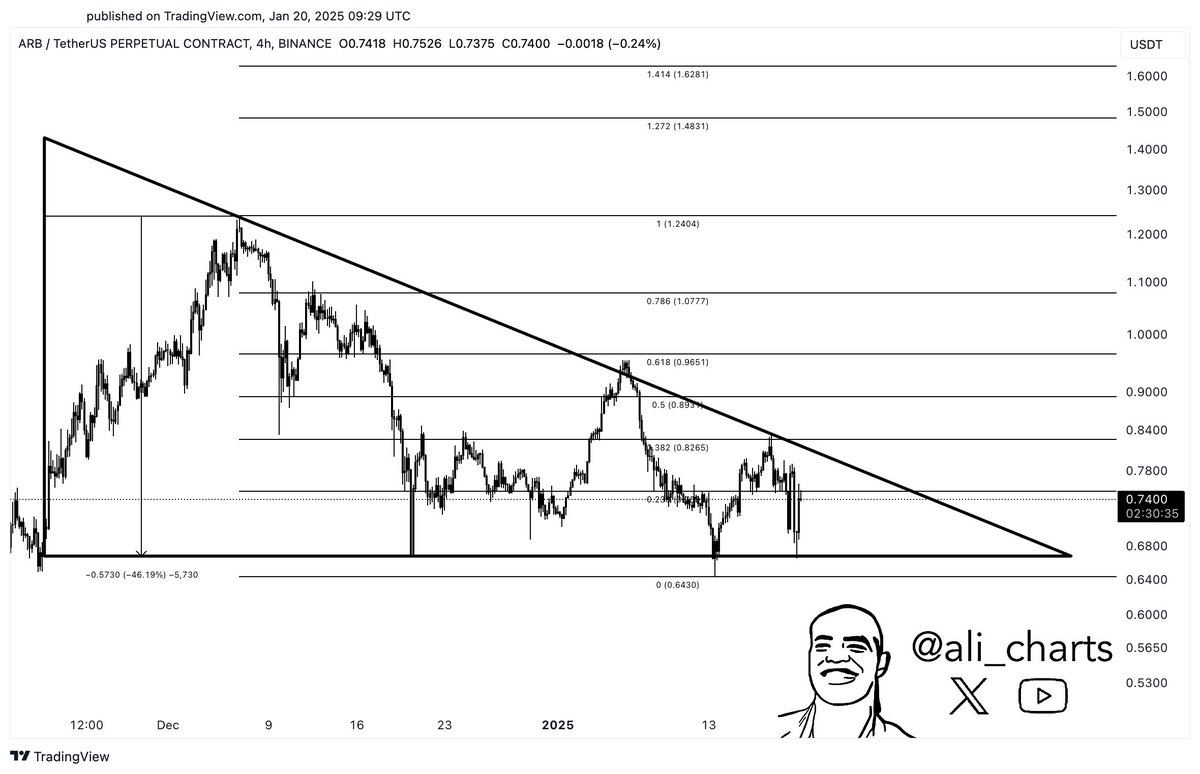
Supporting the upside chances, Ali Martinez, a crypto analyst, has highlighted a bullish analysis for Arbitrum. In his recent X post, formerly Twitter, Martinez highlights a descending triangle pattern holding the ARB price trend.
In case of a breakout rally, ARB price is likely to test the previous peak at $1.2404. This reveals an upside potential of 46% if the buyers manage to overcome the resistance trendline.
Arbitrum’s price action teeters on a critical support level, with a breakout rally toward $1 hinging on broader market stabilization. However, a breach below $0.665 could accelerate bearish momentum, testing deeper support zones near $0.62.
Disclaimer: Coinspeaker is committed to providing unbiased and transparent reporting. This article aims to deliver accurate and timely information but should not be taken as financial or investment advice. Since market conditions can change rapidly, we encourage you to verify information on your own and consult with a professional before making any decisions based on this content.
Vishal, a Bachelor of Science graduate, began his journey in the crypto space during the 2021 bull run and has since navigated the subsequent market winter. With a strong technical background, he is dedicated to delivering insightful articles rich in technical details, empowering readers to make well-informed decisions.