Bitcoin Price Analysis: BTC/USD Continues Sideways, Expecting Breakout at $5,299
The bullish breakout of Bitcoin price at $5,299 level will expose the coin to $5,574 resistance level which may be its target in case the bulls increase its pressure. Should the resistance level of $5,229 holds, BTC price may continue its ranging movement.
By Azeez Mustapha
Updated
2 mins readPhoto: Tim Reckmann / Flickr
traders should be patient before taking a position.
BTC/USD Medium-term Trend: Ranging
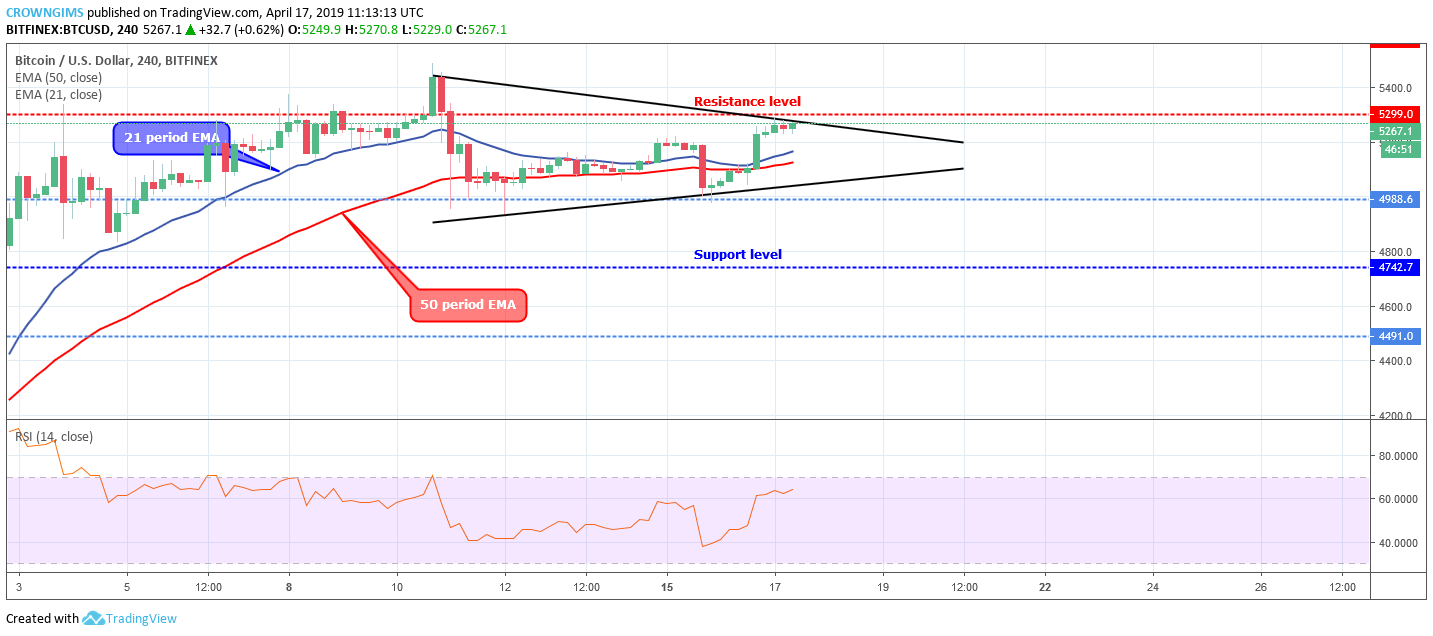
Resistance levels: $5,299, $5,574, $5,840
Support levels: $4,988, $4,742, $4,491BTC/USD continues sideways movement on the medium-term outlook. The sideways movement of Bitcoin price continues on the 4-hour chart. The crypto started ranging six days ago till the present moment. It is range–bound within the resistance of $5,299 and the support level of $4,988. It is currently touching the resistance level of $5,299 in which a sign of rejection is emerging; that is the bearish candles.
The 21 periods EMA and 50 periods EMA are coming closer to each other and the coin is hovering over the two EMAs which indicate that consolidation is ongoing in the BTC market. The relative strength Index period 14 is at 70 levels horizontally flat at the level showing no direction; this is a confirmation of consolidation on the medium-term outlook.
The bullish breakout of Bitcoin price at $5,299 level will expose the coin to $5,574 resistance level which may be its target in case the bulls increase its pressure. Should the resistance level of $5,229 holds, BTC price may continue ranging movement.
BTC/USD Short-term Trend: Bullish
BTC/USD is bullish on the short-term outlook. Bitcoin price bounced from the support level of $4,988.The formation of a hammer candle at the mentioned level signaled the arrival of the bulls into the BTC market on the hourly chart. The Bulls broke up the dynamic resistance levels (21 and 50 periods EMA) and propelled the coin towards the resistance level of $5,299 within a rising channel.
The 21 periods EMA has crossed the 50 periods EMA, well separated from each other and pointing to the north; this indicates a strong bullish trend. The Relative Strength Index period 14 is at 70 levels with the signal line pointing up to indicate a buy signal.
Azeez Mustapha is a specialist in Computer Studies (including DTP), Forex and Crypto trading professional. Being expert technical and currency analyst, as well as experienced fund manager and author of several books, Azeez places strong focus on crypto market studies conducting comprehensive price analyses and sharing forecasts of presumptive market trends.

 BTC/USD continues sideways movement on the medium-term outlook. The sideways movement of Bitcoin price continues on the 4-hour chart. The crypto started ranging six days ago till the present moment. It is range–bound within the resistance of $5,299 and the support level of $4,988. It is currently touching the resistance level of $5,299 in which a sign of rejection is emerging; that is the bearish candles.
 BTC/USD is bullish on the short-term outlook. Bitcoin price bounced from the support level of $4,988.The formation of a hammer candle at the mentioned level signaled the arrival of the bulls into the BTC market on the hourly chart. The Bulls broke up the dynamic resistance levels (21 and 50 periods EMA) and propelled the coin towards the resistance level of $5,299 within a rising channel.


