Bitcoin Price Analysis: BTC/USD May Bounce at $5,459 Targeting $5,574 Price Level
Higher bearish pressure will break down the demand level of $5,459 and it may extend to the $5,255 demand level. In case the demand level of $5,459 holds, Bitcoin price may bounce and have its high at $5,574.
By Azeez Mustapha
Updated
2 mins readPhoto: QuoteInspector
Key Highlights:
Bitcoin price may bounce at the $5,459 support level;
the breakout at $5,459 level will expose $5,255 demand level;
double top chart pattern noticed on the 1-hour chart.
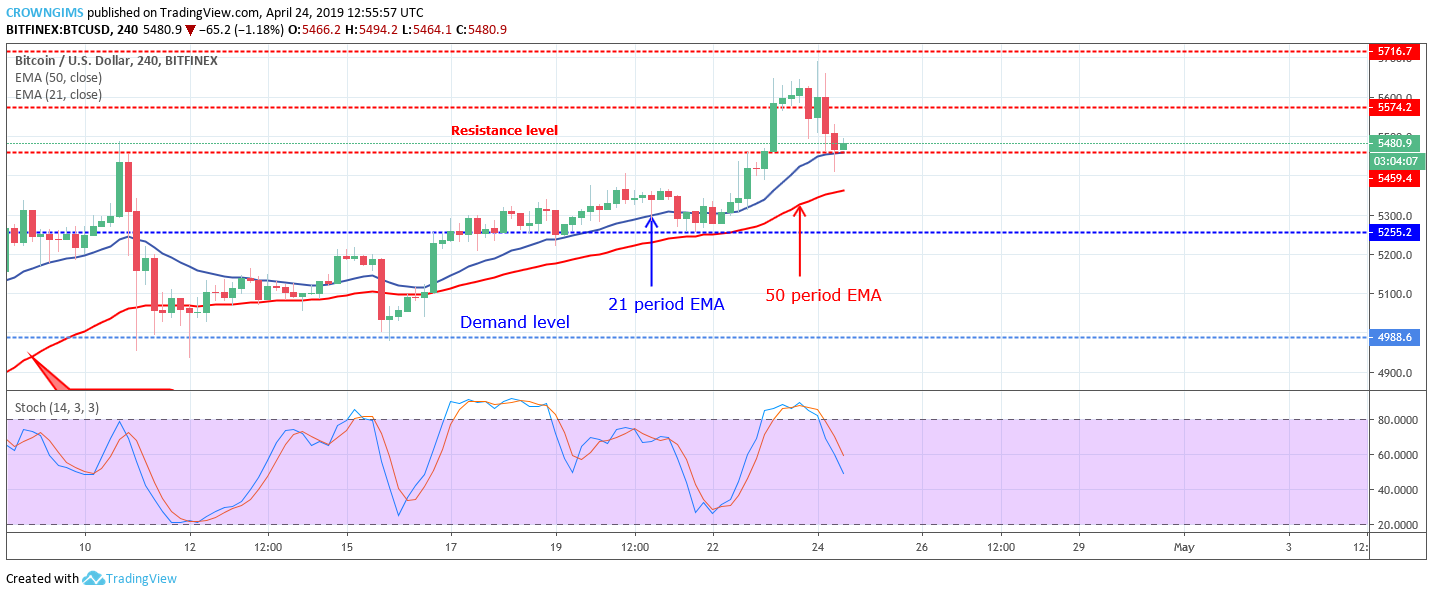
BTC/USD Medium-term Trend: Bullish
Resistance levels: $5,459, $5,574, $5,716
Support levels: $5,255, $4,988, $4,742BTC/USD price increased on the medium-term outlook. The bulls put an end to the range-bound movement that started on April 17 within the supply level of $5,955 and the demand level of $5,255. A strong bullish candle emerged which penetrated the strong resistance levels at $5,459 and $5,574, then, the coin rallied to the north and touch the higher resistance level at $5,716.
The bullish momentum was lost at the level; the Bears took over by exerted a selling pressure. The coin is heading towards the south. The selling pressure has placed Bitcoin price at $5,459 level at the time of writing this report.
Though the coin still remains above the 21 period EMA and 50 periods EMA; the bearish candle directly touching the 21 periods EMA. The Stochastic Oscillator period 14 is at 60 with the signal lines pointing downward to indicate sell signal.
Higher bearish pressure will break down the demand level of $5,459 and it will extend to the $5,255 demand level. In case the demand level of $5,459 holds, Bitcoin price may bounce and have its high at $5,574.
BTC/USD Short-term Trend: Bearish
BTC/USD is on the bearish movement on the short-term outlook. Bitcoin price seems to form a double top chart pattern on the 1-hour chart. The Bears rolled down the price towards $5,459 price level. A pin bar bullish candle is noticed at the mentioned level; this is a bullish reversal pattern which may drive the price up to the $5,574 level.
BTC price is currently below the 21 periods EMA and 50 periods EMA with the price increasing towards the two EMAs.
Meanwhile, the Stochastic Oscillator period 14 is at 20 levels with the signal lines pointing upward to indicate buy signal and gradual increase of the Bulls’ momentum.
Azeez Mustapha is a specialist in Computer Studies (including DTP), Forex and Crypto trading professional. Being expert technical and currency analyst, as well as experienced fund manager and author of several books, Azeez places strong focus on crypto market studies conducting comprehensive price analyses and sharing forecasts of presumptive market trends.
 BTC/USD price increased on the medium-term outlook. The bulls put an end to the range-bound movement that started on April 17 within the supply level of $5,955 and the demand level of $5,255. A strong bullish candle emerged which penetrated the strong resistance levels at $5,459 and $5,574, then, the coin rallied to the north and touch the higher resistance level at $5,716.
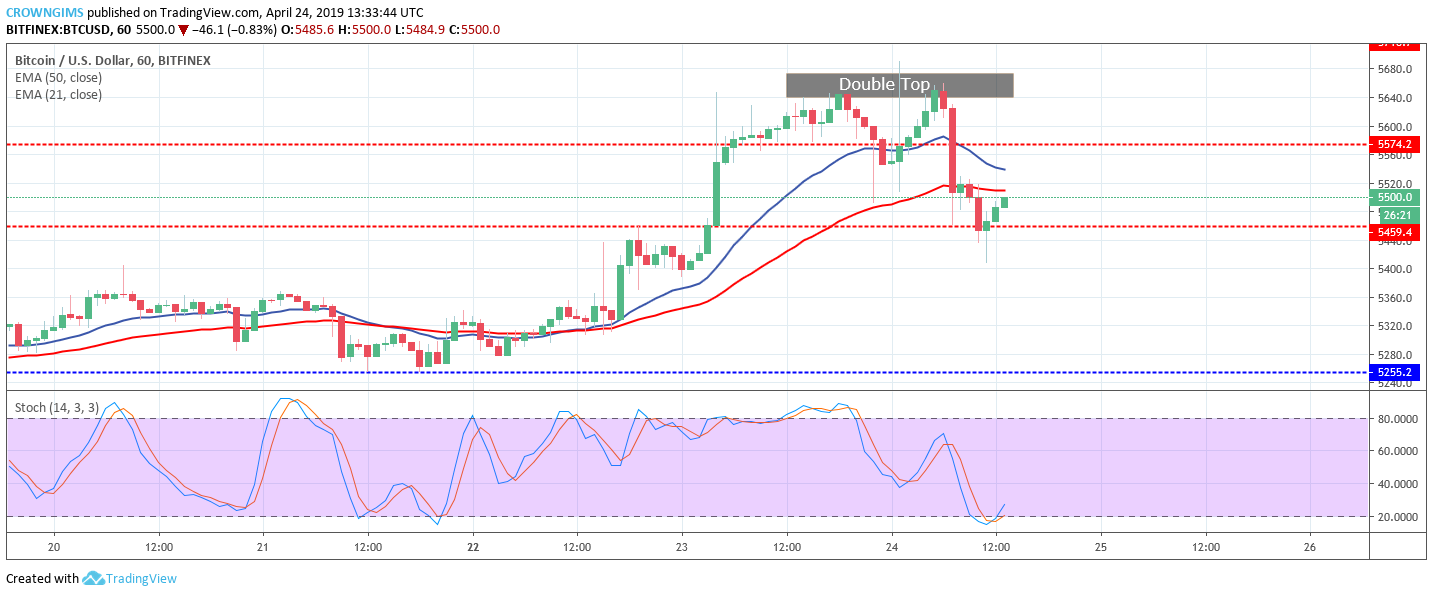 BTC/USD is on the bearish movement on the short-term outlook. Bitcoin price seems to form a double top chart pattern on the 1-hour chart. The Bears rolled down the price towards $5,459 price level. A pin bar bullish candle is noticed at the mentioned level; this is a bullish reversal pattern which may drive the price up to the $5,574 level.


