Bitcoin Price Analysis: BTC/USD Trends of February 18–24, 2019
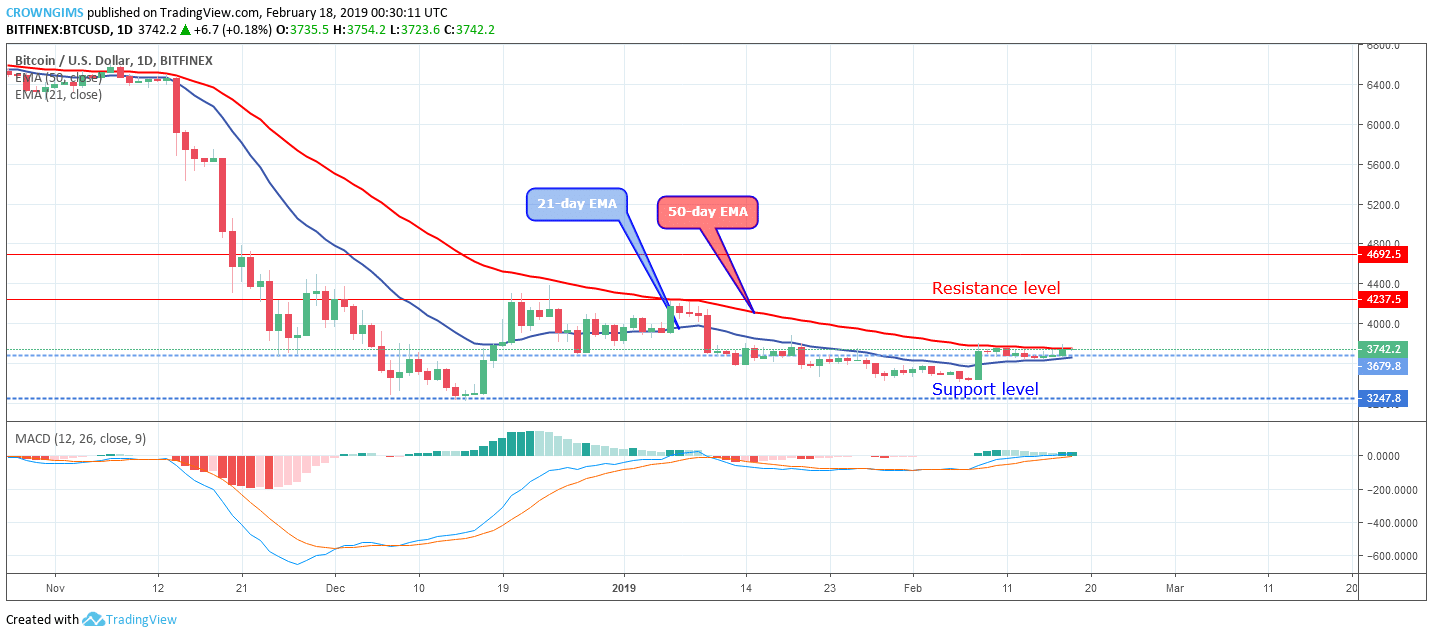
Bitcoin price may have its high at $4,237 in case the demand level of $3,679 holds and the Bulls gained enough momentum. Also, the BTC price will find its low at $3,247 if there is a breakdown of the $3,679 price level.
By Azeez Mustapha
Updated
2 mins readPhoto: QuoteInspector
Key Highlights:
Consolidation movement confirmed on Bitcoin market;
in case the $3,679 level holds, the bulls may take over the market;
the break out is imminent.
BTC/USD Long-term Trend: Ranging
Resistance levels: $4,237, $4,692, $5,600
Support levels: $3,679, $3,247, $2,765BTC/USD is consolidating on the long-term outlook. There was not any serious rally on the BTC market last week. The momentum of both the bears and the bulls remain at equilibrium; that is the crypto was consolidating on and around the support level of $3,679.
It is noticed that there is a strong confluence at the Bitcoin price level of $3,679 that is one of the major reasons why the BTC price remains in the consolidation movement for a long period. A radical force or fundamental events is needed before the coin break out of the zone.
The two EMAs are already closed together and the BTC price continues trading in between the 21-day EMA and 50-day EMA in which it serves as an indication that consolidation is ongoing on the daily chart in the BTC market. Meanwhile, the MACD with its histogram is horizontally flat on the zero levels and its signal lines are also flat on the zero levels. It is advisable that the traders should remain flat until a clear cut breakout is seen before placing a trade.
Bitcoin price may have its high at $4,237 in case the demand level of $3,679 holds and the Bulls gained enough momentum. Also, the BTC price will find its low at $3,247 if there is a breakdown of the $3,679 price level.
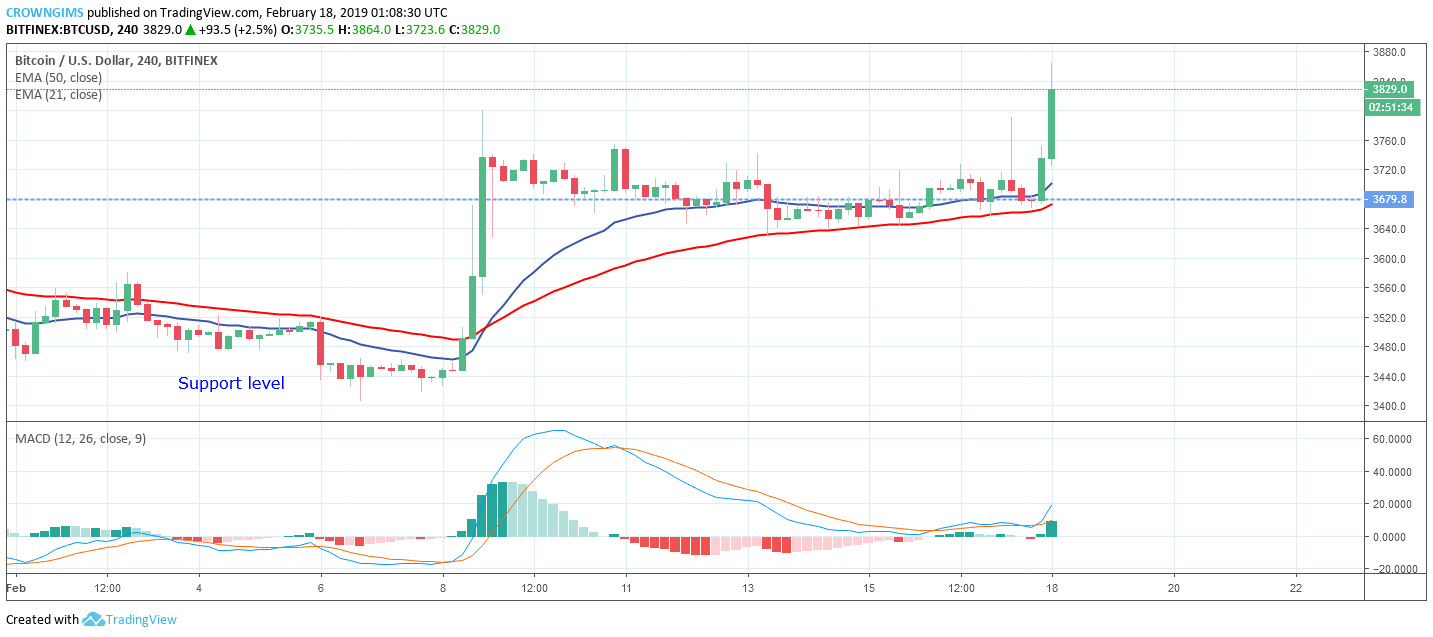
BTC/USD Medium-term Trend: Bullish
On the medium-term outlook, BTC/USD is still on the bullish trend. The coin was on the sideways movement on and around the $3,679 support level throughout last week after Bitcoin price retracement. The Japanese candle that opened today’s market is bullish which connotes a high probability of uptrend continuation after the pullback.
The 21-day EMA remains above the 50-day EMA and the BTC price is trading above the two EMAs which confirm the bullish trend on the 4-Hour chart. Meanwhile, the Moving Average Convergence Divergence period 12 with its histogram is above the zero levels and the signal lines above zero level pointing upward indicates buy signal.
Azeez Mustapha is a specialist in Computer Studies (including DTP), Forex and Crypto trading professional. Being expert technical and currency analyst, as well as experienced fund manager and author of several books, Azeez places strong focus on crypto market studies conducting comprehensive price analyses and sharing forecasts of presumptive market trends.

 BTC/USD is consolidating on the long-term outlook. There was not any serious rally on the BTC market last week. The momentum of both the bears and the bulls remain at equilibrium; that is the crypto was consolidating on and around the support level of $3,679.