By Dmitriy Gurkovskiy, Chief Analyst at RoboForex.
- The number of large amount BTC wallets is considerably up.
- What Awaits the Bitcoin? Opinions are controversial.
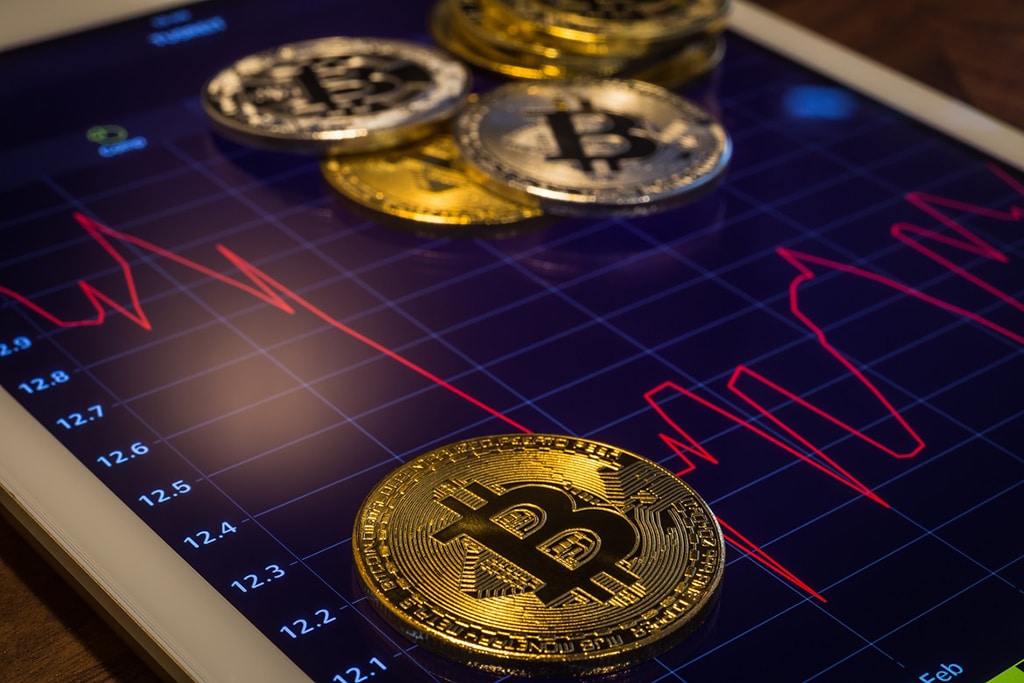
According to Dial report, the number of BTC wallets with BTC 1,000 to BTC 10,000 has increased drastically over the last nine months. The number of those with under BTC 100 is also up. Thus, over the last three quarters, the wallets with under BTC 10,000 have around 26% of all bitcoins issued. This means people were buying bitcoins in small amounts while the market was falling. All the wallets in question are active and have recent transfer history.
Once the crypto market got especially volatile, many predictions on Bitcoin price appear. Thus, Andy Cheung, OKEx Director of Operations, is sure the flagship is ready to conquer $20,000 before the year ends. This is a conservative scenario, he adds, and the price is unlikely to stop there.
Others are not that optimistic, though. Naeem Aslam, a Forbes representative, says the BTC is going to take over $10,000 and fall shortly after.
The most pessimistic scenario is described by a user nicknamed MagicPoopCannon. This TradingView expert says the BTC is going to reach $3,000 by October. The bearish phase is not quite over yet, he says, and the fall may be very dangerous.
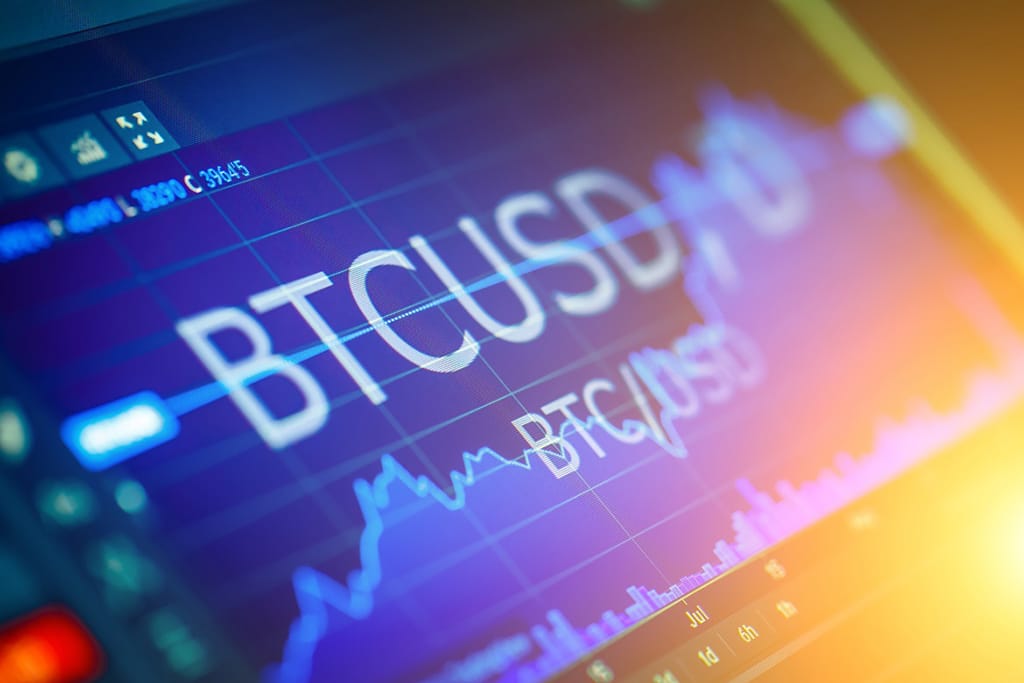
Anyways, the BTC is the most highly rising crypto by now, having added 65.50% to its value since early May. On W1, the correction trend reached 38.20% Fibo. The price has a bit slowed down, which may signal a nearby pullback. Still, the Stochastic is definitely up after forming a golden cross, so the BTC may continue rising to 50% and 61.80% Fibo, or $10,170 and $11,840, respectively.
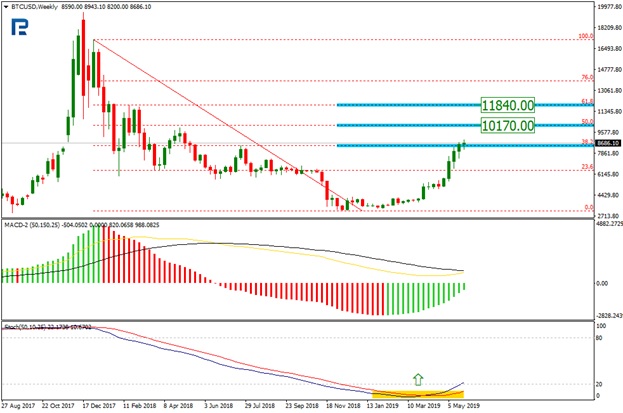
Photo: Roboforex / TradingView
On D1, the BTC is currently moving steadily along an ascending channel, and while it stopped at 38.20%, this may be none other than a pause before another leap to $10,170. A very deep pullback may occur as well: once the price hits $8,000, it may fall further down to $6,440. The MACD, however, is not issuing any reversal signals, confirming the midterm rise.
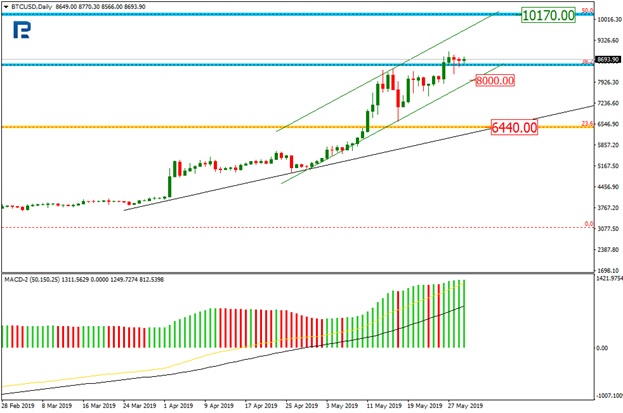
Photo: Roboforex / TradingView
On H4, a triangle has been formed, and once the price breaks it out, it may hit the short term channel resistance at $9,745. The Stochastic is meanwhile diverging, which may send the crypto lower during the correction phase.
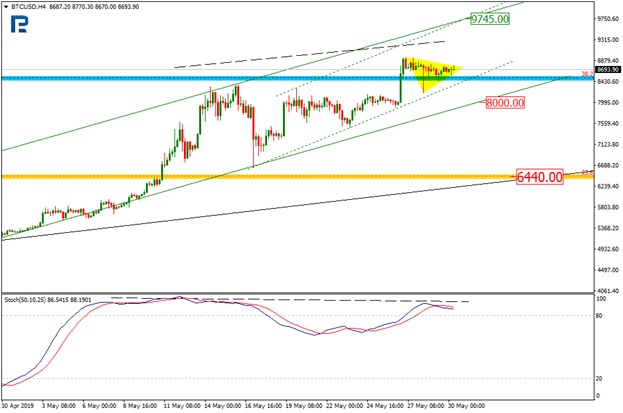
Photo: Roboforex / TradingView
Disclaimer: Coinspeaker is committed to providing unbiased and transparent reporting. This article aims to deliver accurate and timely information but should not be taken as financial or investment advice. Since market conditions can change rapidly, we encourage you to verify information on your own and consult with a professional before making any decisions based on this content.

Dmitriy Gurkovskiy is a senior analyst at RoboForex, an award-winning European online foreign exchange forex broker.