Author
staff writer
Since the launch of ETFs, Bitcoin (BTC) has broken above all the significant levels and might be targeting a new all-time high.
 Edited by Kseniia Klichova
Updated
3 mins read
Edited by Kseniia Klichova
Updated
3 mins read

The introduction of nine Bitcoin spot ETFs has begun a new chapter for crypto investments. Spearheaded by financial giants, these ETFs have collectively surpassed 300,000 BTC in AUM in a concise timeframe. This milestone is particularly notable as it represents nearly 1.5% of Bitcoin’s total supply.
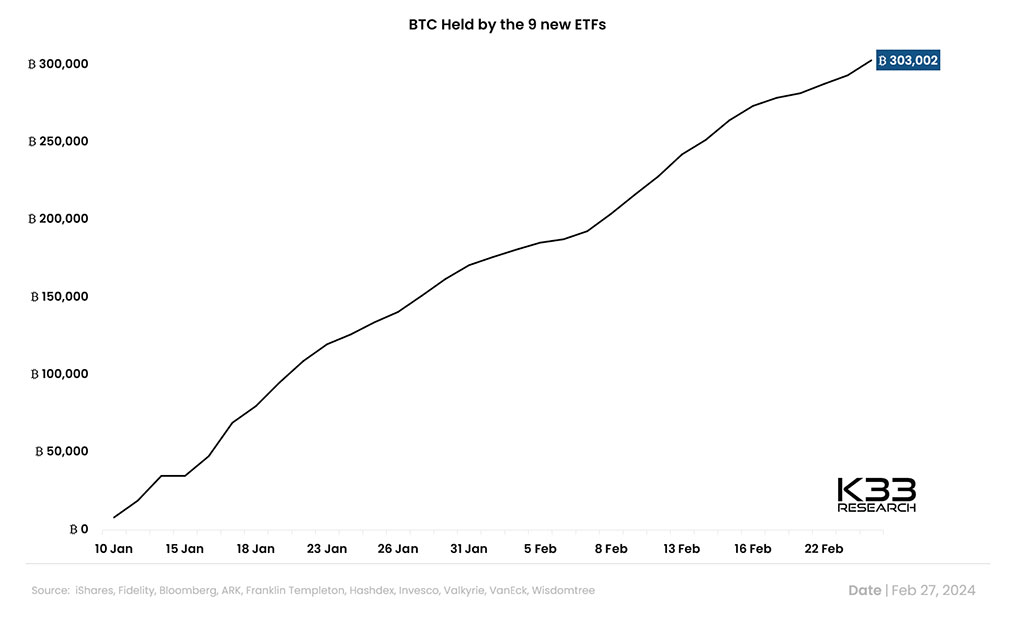
Photo: K33 Reserach
The financial landscape for Bitcoin ETFs was particularly vibrant on February 26, 2024, as these instruments saw a staggering $520 million in net inflows, equivalent to 9,510 BTC. This surge propelled the total net inflows since their inception to over $6 billion. The ETFs’ trading volume on the same day reached an all-time high of $2.4 billion, with BlackRock’s ETF leading the pack by crossing the $1 billion mark in trading volume alone.
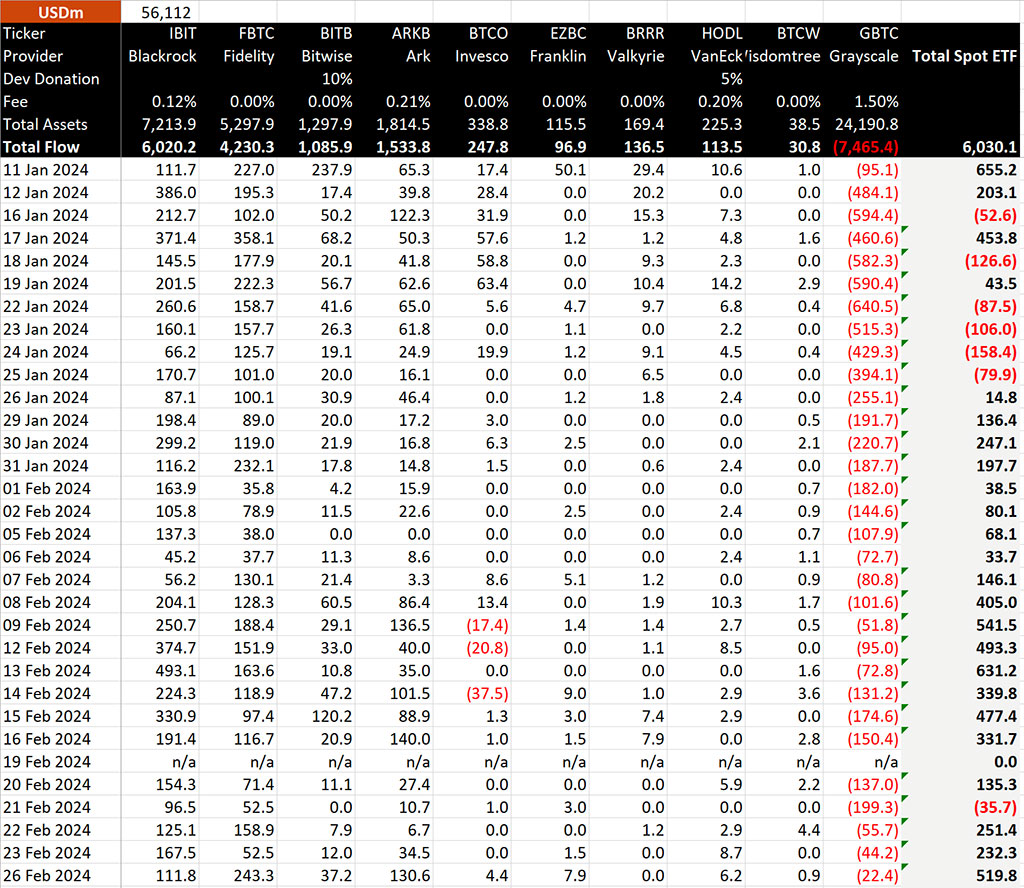
Among the ETFs, Fidelity’s FBTC and BlackRock‘s IBIT have emerged as frontrunners, amassing significant assets under management. Fidelity’s ETF, in particular, led the inflows on February 26, with a remarkable $243.3 million added to its coffers, showcasing the trust and optimism investors have in these financial products.
The rise of spot Bitcoin ETFs has been distinguished by the gradual decline of Grayscale’s GBTC, once a preferred choice for Bitcoin exposure among investors. The total outflows for GBTC are accounted to be around $7.5 billion.
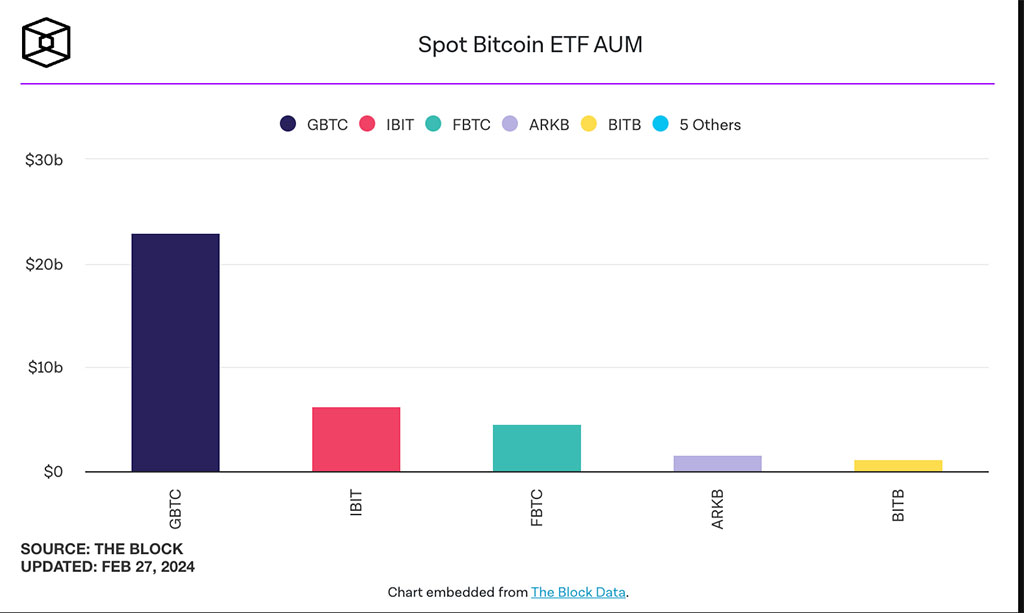
Photo: The Block
Besides the total AUM of GBTC fell by 28% from $35 million to $25 billion since the launch of Bitcoin spot ETFs, it still has the largest AUM compared to its competitors, including IBIT, FBTC, ARKB, BITB, and others.
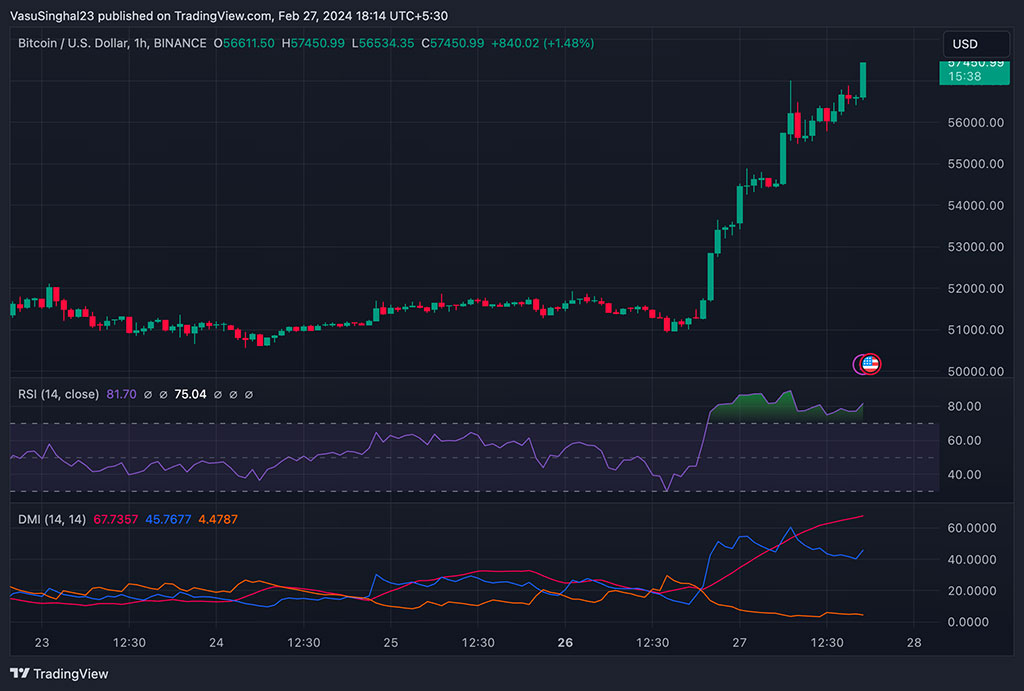
Photo: TradingView
Since the launch of ETFs, Bitcoin (BTC) has broken above all the significant levels and might be targeting an all-time high of approximately $68,000. As of the last visible price on the chart, Bitcoin is trading at $57,480.99. The chart indicates a strong upward trend, with the price of Bitcoin increasing significantly over the period shown. The large green candles represent periods where the closing price was higher than the opening price, signaling buying pressure and bullish sentiment.
The RSI is currently at 81.70, which traditionally indicates that the asset may be overbought. Typically, an RSI above 70 suggests that an asset might be getting overvalued and could be due for a pullback or correction.
Below the RSI, the Directional Movement Index (DMI) is plotted, consisting of the ADX (Average Directional Index), +DI (Positive Directional Indicator), and -DI (Negative Directional Indicator). The ADX, in orange, indicates the strength of the trend, and at a value of 67.7357, it suggests a strong trend. The +DI, in blue, is above the -DI, in red, which confirms the presence of a solid upward trend.
In conclusion, the chart presents a solid bullish momentum for Bitcoin, with the price reaching higher highs. However, the high RSI reading warns of potential overbought conditions that could lead to a reversal or consolidation in the near term. Traders might be cautious and watch for possible signs of a trend reversal due to the heightened RSI levels.
Disclaimer: Coinspeaker is committed to providing unbiased and transparent reporting. This article aims to deliver accurate and timely information but should not be taken as financial or investment advice. Since market conditions can change rapidly, we encourage you to verify information on your own and consult with a professional before making any decisions based on this content.