Bitcoin SV Price Analysis: BSV/USD Trends of December 19–25
In case the bears defend the resistance level of $92 the rice will bounce and Bitcoin SV will resume its downtrend and have its target at the previous low.
By Azeez Mustapha
Updated
2 mins readPhoto: Pavlos Giorkas / Flickr
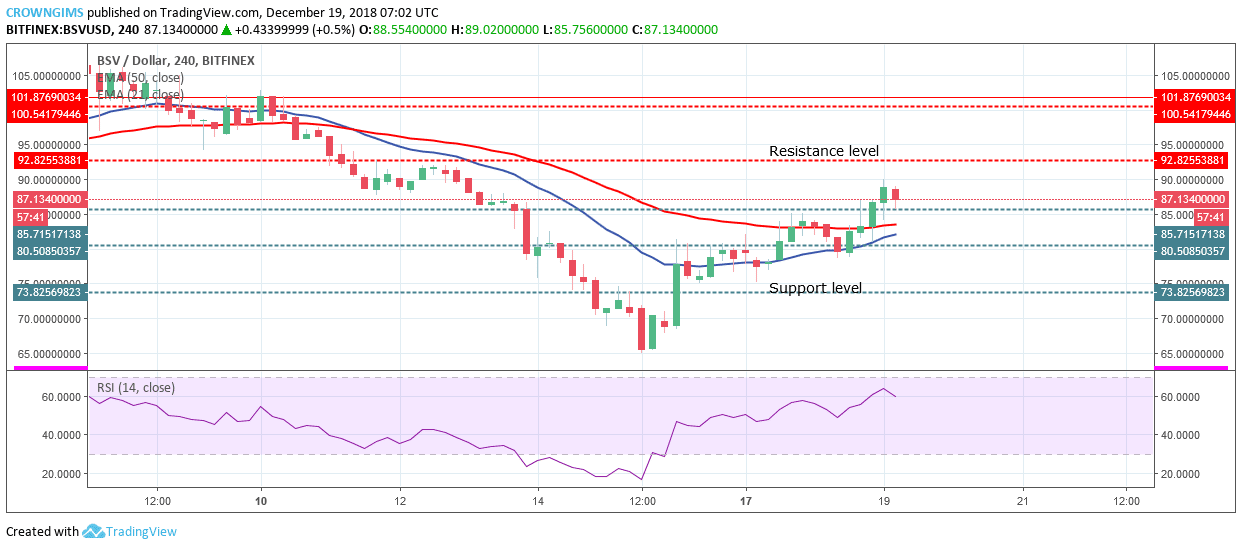
Resistance levels: $92, $100, $106
Support levels: $85, $80, $73BSV/USD is on the bullish trend on the medium-term outlook. As predicted last week, the bears pushed the Bitcoin SV price downside and broke the $89 price level and the crypto found the support at $65. Later, the bears lost the pressure. The bullish inside bar candle pattern formed indicates the increase of bullish momentum which pushed the BSV price up and broke up many barriers such as $73, $80 and $85 old resistance levels.
The 21-day EMA is making an attempt to cross the 50-day EMA upside and the BSV price is trading above the 50-day EMA which indicate the bullish pressure on the BSV market is high. Bitcoin SV price is currently on the support level of $85 exposed to the resistance level of $92 where it is retesting the broken level as this is the characteristics of a trending market. The relative strength index period 14 is at 60 levels pointing down indicates sell signal which may be a pullback for the trend to continue.
Should the bulls maintain their momentum, BSV price may have its high at $100 resistance level. On the other hand, in case the bears defend the resistance level of $92, the price will bounce and Bitcoin SV will resume its downtrend and have its target at the previous low.
BSV/USD Price Short-term Trend: Bullish
BSV/USD is bullish on the short-term outlook. The coin fell to the low of $65 on December 15. The bulls gained momentum; this is confirmed by the bullish inside bar candle formed. BSV price rallied to the north to break former resistance levels of $73, $80 and $85. The BSV market has been making higher highs movement.
Bitcoin SV price is above the 21-day EMA and 50-day EMA with several downward rejections at the two EMAs, which indicates that the bulls are in control of the BSV market. The relative strength index period 14 is below 60 levels pointing down indicates sell signal which may be temporary before an uptrend continues.
Azeez Mustapha is a specialist in Computer Studies (including DTP), Forex and Crypto trading professional. Being expert technical and currency analyst, as well as experienced fund manager and author of several books, Azeez places strong focus on crypto market studies conducting comprehensive price analyses and sharing forecasts of presumptive market trends.

 BSV/USD is on the bullish trend on the medium-term outlook. As predicted last week, the bears pushed the Bitcoin SV price downside and broke the $89 price level and the crypto found the support at $65. Later, the bears lost the pressure. The bullish inside bar candle pattern formed indicates the increase of bullish momentum which pushed the BSV price up and broke up many barriers such as $73, $80 and $85 old resistance levels.
 BSV/USD is bullish on the short-term outlook. The coin fell to the low of $65 on December 15. The bulls gained momentum; this is confirmed by the bullish inside bar candle formed. BSV price rallied to the north to break former resistance levels of $73, $80 and $85. The BSV market has been making higher highs movement.