
Dmitriy Gurkovskiy, a senior analyst at foreign exchange broker RoboForex, provides his vision of the possible tendencies in price changes for Bitcoin as well as for other major cryptos.
Cryptocurrencies continue to correct without any significant fluctuations in either direction. A lot of assets are stuck inside their respective “Triangle” patterns, thus indicating an extremely low volatility. If such a pattern is broken, it may force a strong movement in the direction of a breakout. In the daily charts, many assets may yet continue trading downwards. However, to confirm a potential downward movement, the assets must break the above-mentioned pattern on shorter timeframes. After that, one may expect the formation of proper patterns in favor of a new growth to break the highs.
Bitcoin
In the daily chart, BTCUSD is rebounding from another resistance level near $7,500. The RSI indicator is also moving very close to the descending trendline, thus indicating a potential rebound from the line after testing it. As a result, one shouldn’t exclude a possible growth and test of $8,000, which is not far from the descending channel’s upside border. After that, Bitcoin is expected to continue falling. The downside target may be at $5,700 and there are risks of seeing a test of the local low at $4,030. However, this scenario may no longer be valid if the pair breaks the channel’s border and fixes above $9,200. In this case, the asset may continue trading upwards and test $10,635.
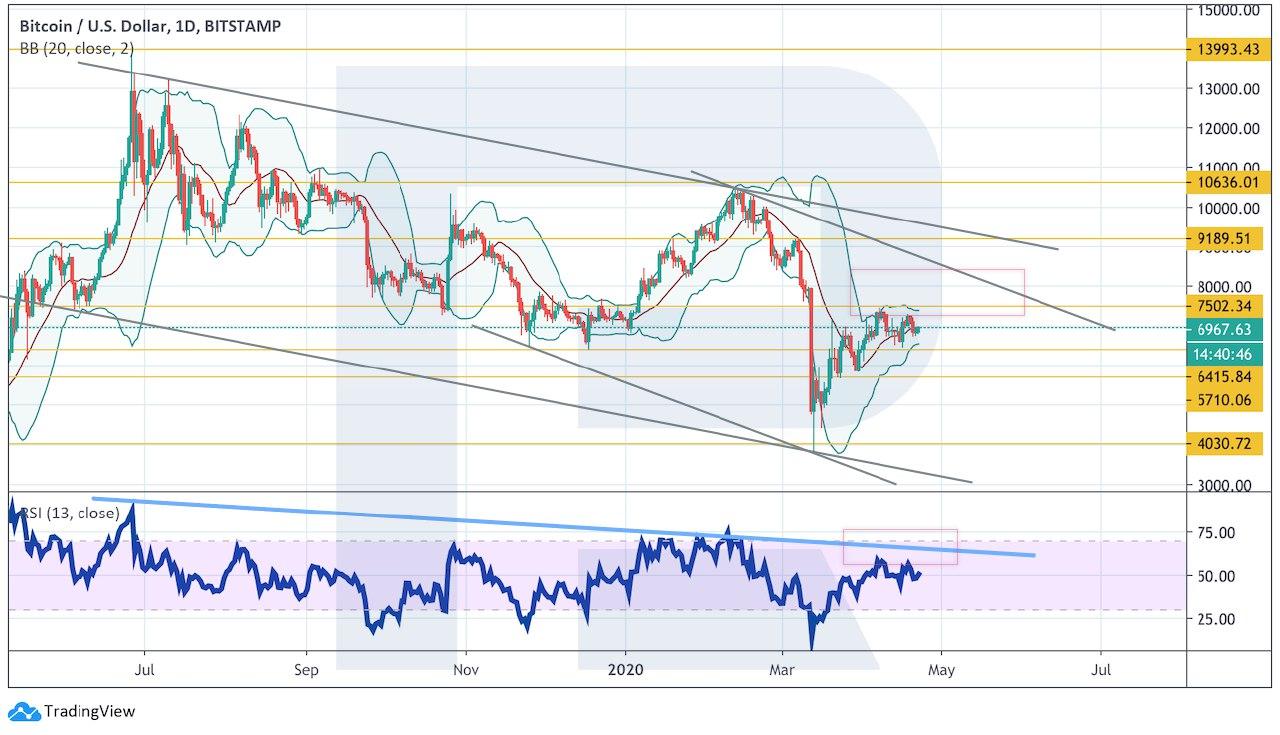
Photo: Roboforex / TradingView
As we can see in the H4 chart, the price is stuck inside a “Triangle” pattern, thus indicating a low volatility. If the pair breaks the pattern’s upside border and fixes above $7,500, the instrument may continue growing to test $8,320 and then resume trading downwards. However, if the asset breaks the pattern’s downside border and fixes below $6,415, the market may continue falling with the target at $5,710 and then $4,975.
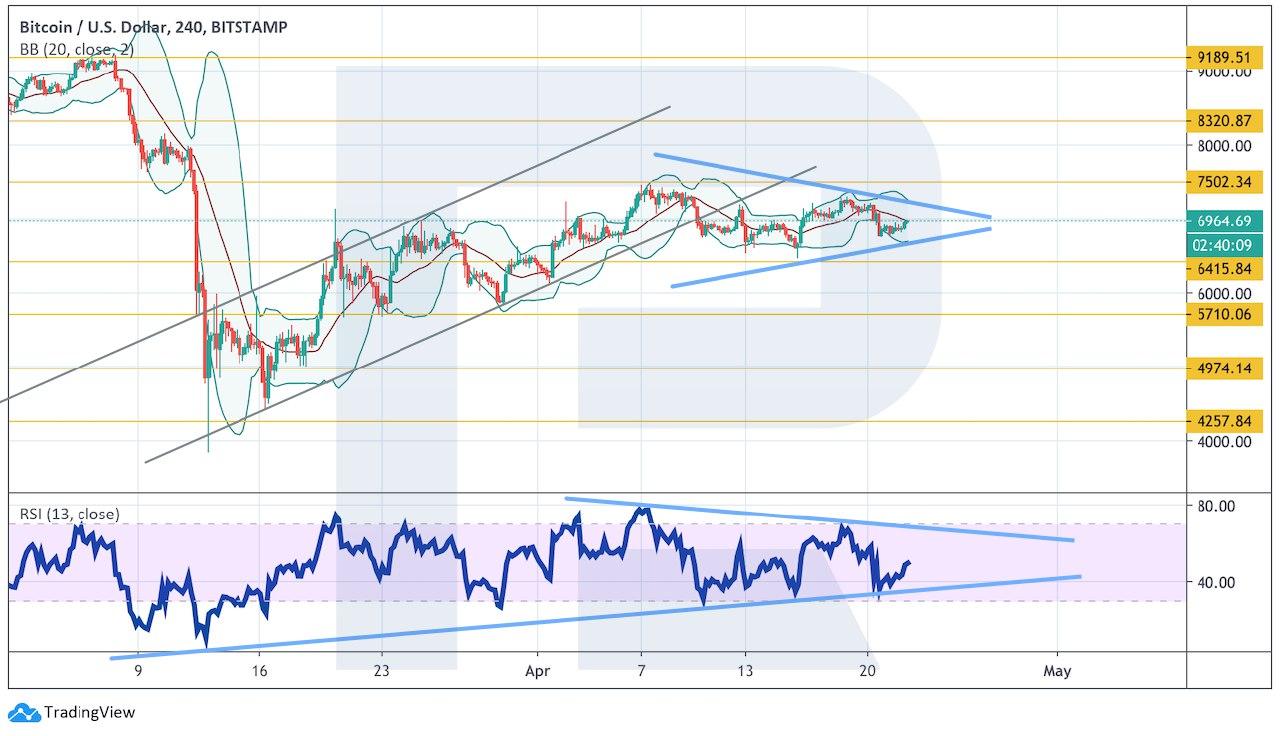
Photo: Roboforex / TradingView
Ethereum
As we can see in the daily chart, Ethereum is rebounding from the Ichimoku Kinko Cloud’s upside border. Bulls managed to get back inside the cloud, which indicates a sideways movement. If the pair breaks the upside border and fixes above $200, it may continue growing towards the descending channel’s upside border at $240. However, the RSI indicator is testing the descending resistance line and there are risks of seeing a further decline in the nearest future. To confirm this scenario, the instrument must break the cloud’s downside border and fix below $144. In this case, the asset may continue falling towards $98.
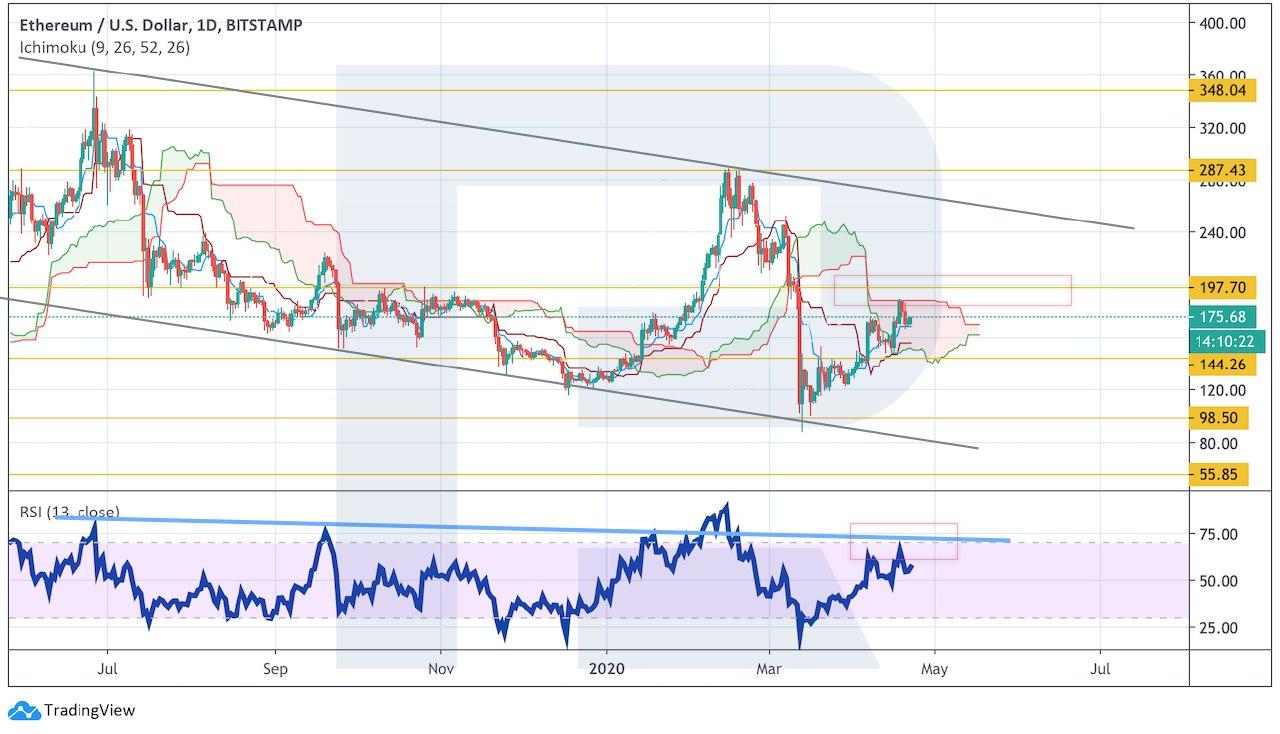
Photo: Roboforex / TradingView
On shorter timeframes, the price is growing inside the rising channel. As soon as ETHUSD falls lower than $167, it may start a new decline with the target at $118 or lower. However, before starting this decline, the pair may yet update its local high. The bearish scenario may be canceled if the asset grows and breaks $208. In this case, the instrument may continue growing to reach $240, which is not far from the descending channel’s upside border from the daily chart.
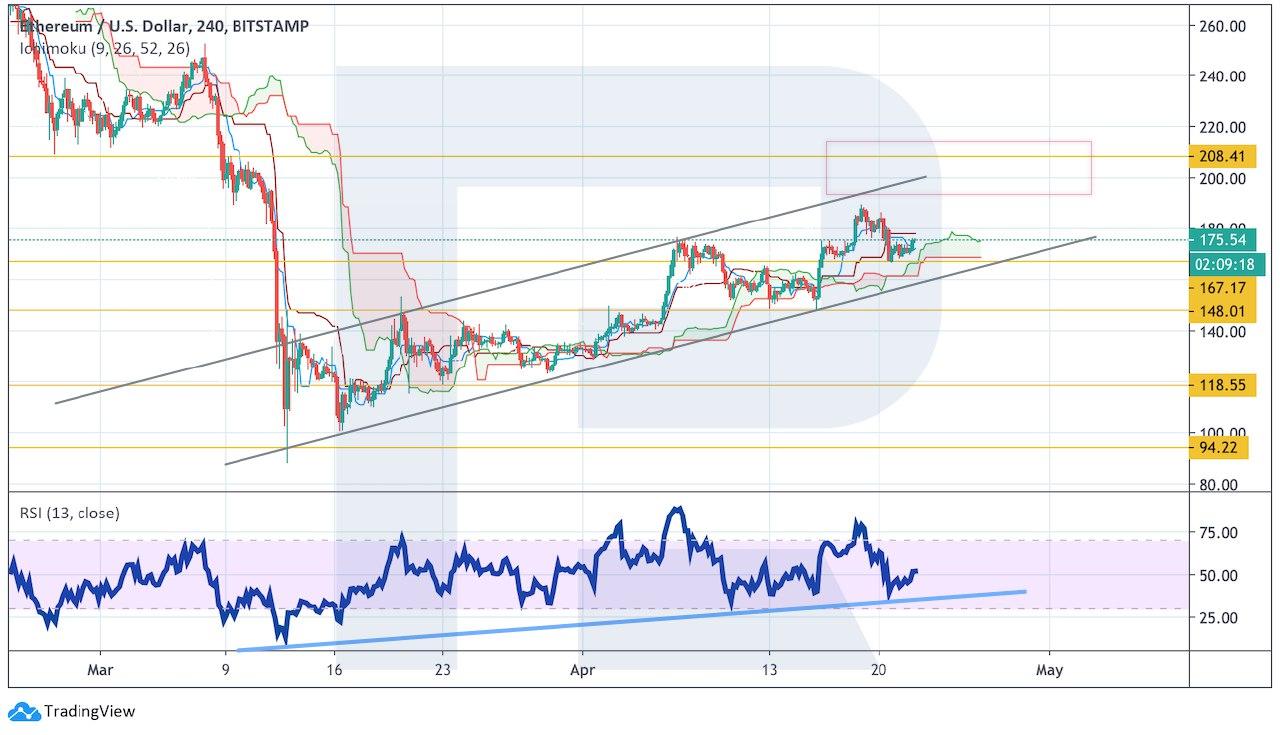
Photo: Roboforex / TradingView
Litecoin
As we can see in the daily chart, LTCUSD has rebounded from the upside border of Bollinger Bands. In case the pair continues falling and breaks $35, one can expect further decline with the target in the area between $27 and $16. Another signal in favor of further growth will be a rebound from the resistance line at the RSI. However, this scenario may be no longer valid if the instrument breaks the descending channel’s upside border and fixes above $65. In this case, the asset may continue growing with the target at $81 and then $105.
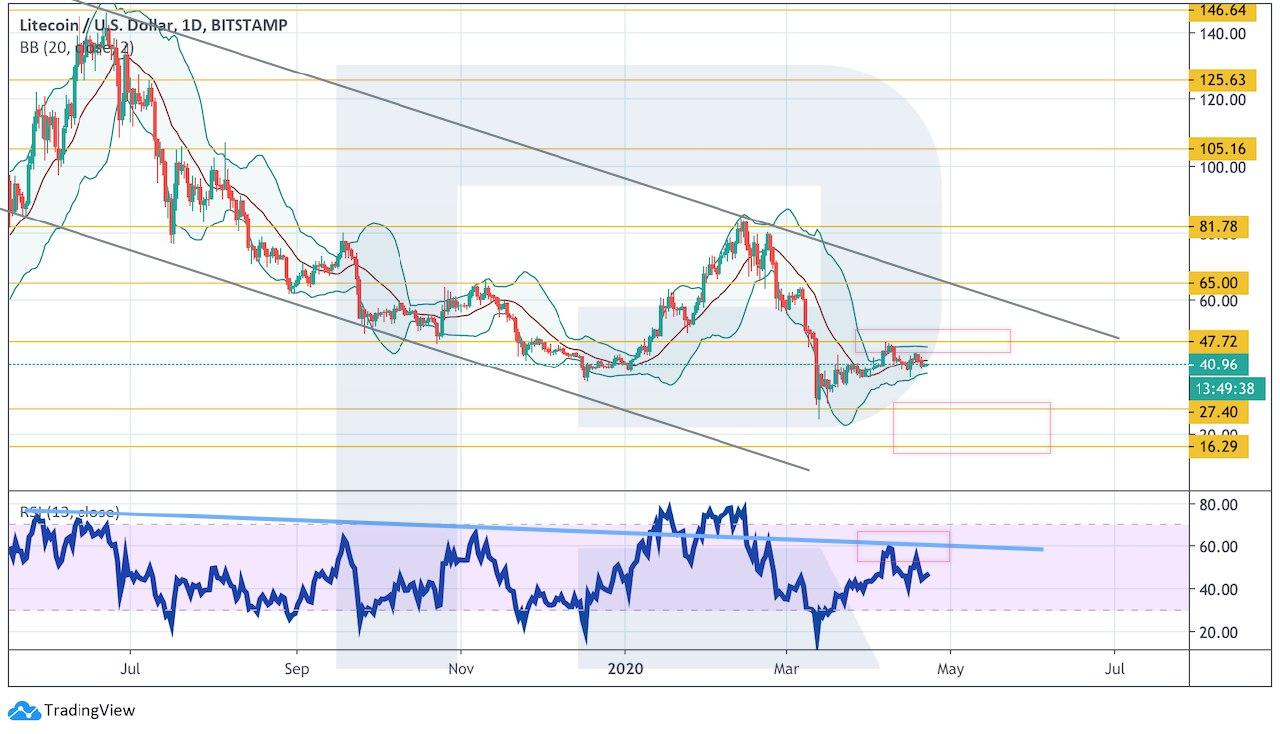
Photo: Roboforex / TradingView
In the H4 chart, the asset is rebounding from Moving Averages, thus indicating the descending tendency. Moreover, it is forming a “Head & Shoulders” pattern. If the price breaks the support level and fixes below $36, it may complete the pattern at $27. A strong signal in favor of this idea is will be a rebound from the trendline at the RSI. However, the bearish scenario may be canceled if the instrument skyrockets and fixes above $47. In this case, the pair may cancel the pattern and continue growing with the target at $55.

Photo: Roboforex / TradingView
EOS
In the daily chart, EOS is rebounding from a quick Moving Average for the second time, thus indicating a bearish pressure. One can expect an attempt to test the descending channel’s upside border and a new decline towards $1.66 and $1.22. A strong signal in favor of this idea will be a rebound from the resistance line at the RSI. At the same time, this scenario may be no longer valid if the instrument skyrockets and breaks $3.29. In this case, the asset is expected to continue growing with the target at $4.72.
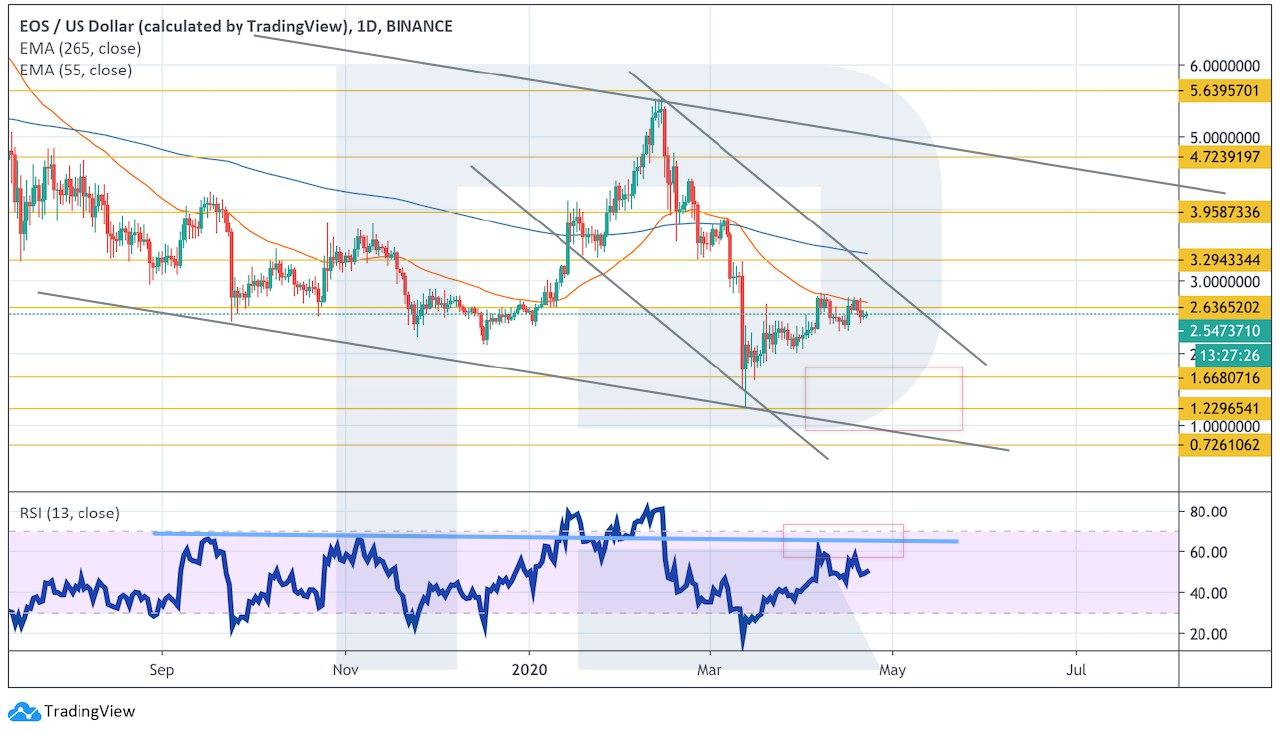
Photo: Roboforex / TradingView
On shorter timeframes, the asset is stuck inside a “Triangle” pattern. If the pair breaks the pattern’s downside border and fixes below $2.28, it may start a new decline with the first target at $2.02. Another signal to confirm this scenario will be a rebound from the trendline at the RSI. However, this scenario may be canceled if the price breaks the pattern’s upside border and fixes above $2.85. In this case, the instrument may continue trading upwards to reach $3.29.
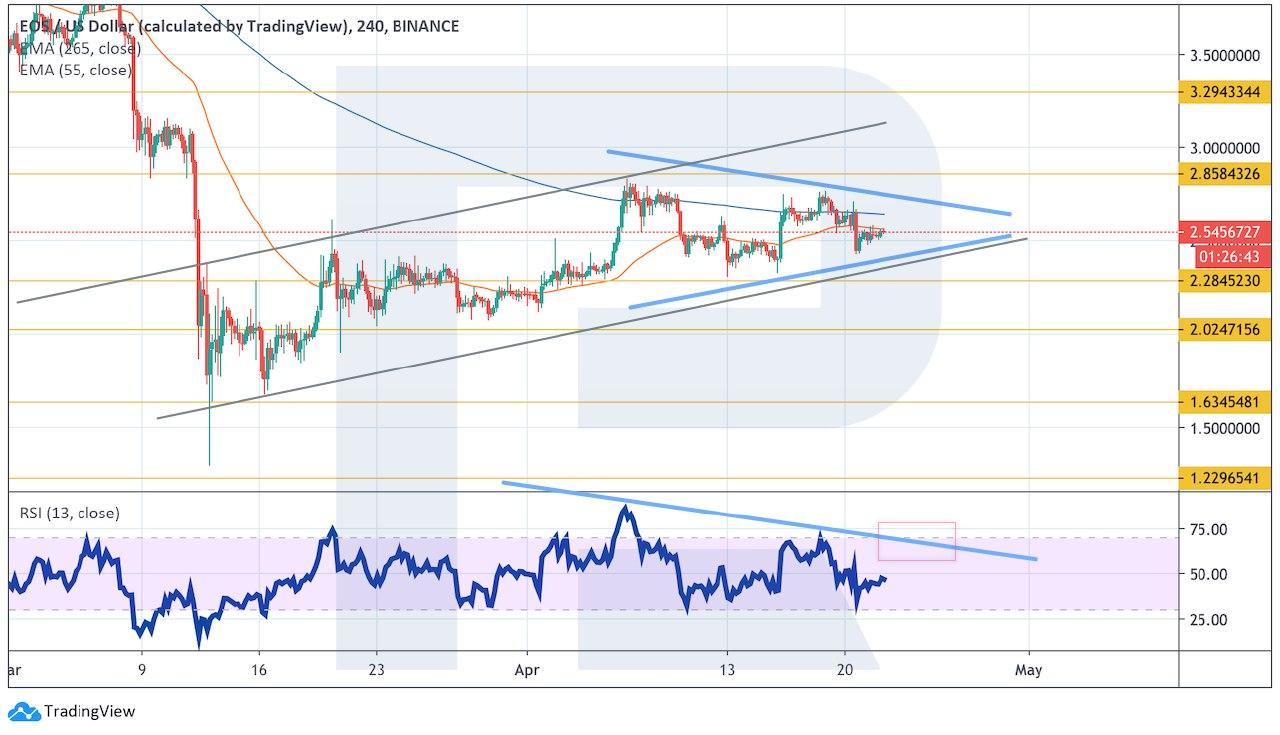
Photo: Roboforex / TradingView
Bitcoin Cash
As we can see in the daily chart, Bitcoin Cash has rebounded from a quick Moving Average, thus indicating a bearish pressure. Moreover, there is a potential for the materialization of a “5-0” descending pattern. In most cases, after rebounding from the descending channel’s upside border, the pair falls towards the local low, which here is not far from $136 and $80. However, this scenario may be no longer be valid if the price skyrockets and fixes above $285. In this case, the instrument may continue growing with the predicted target at $450 and then $495.
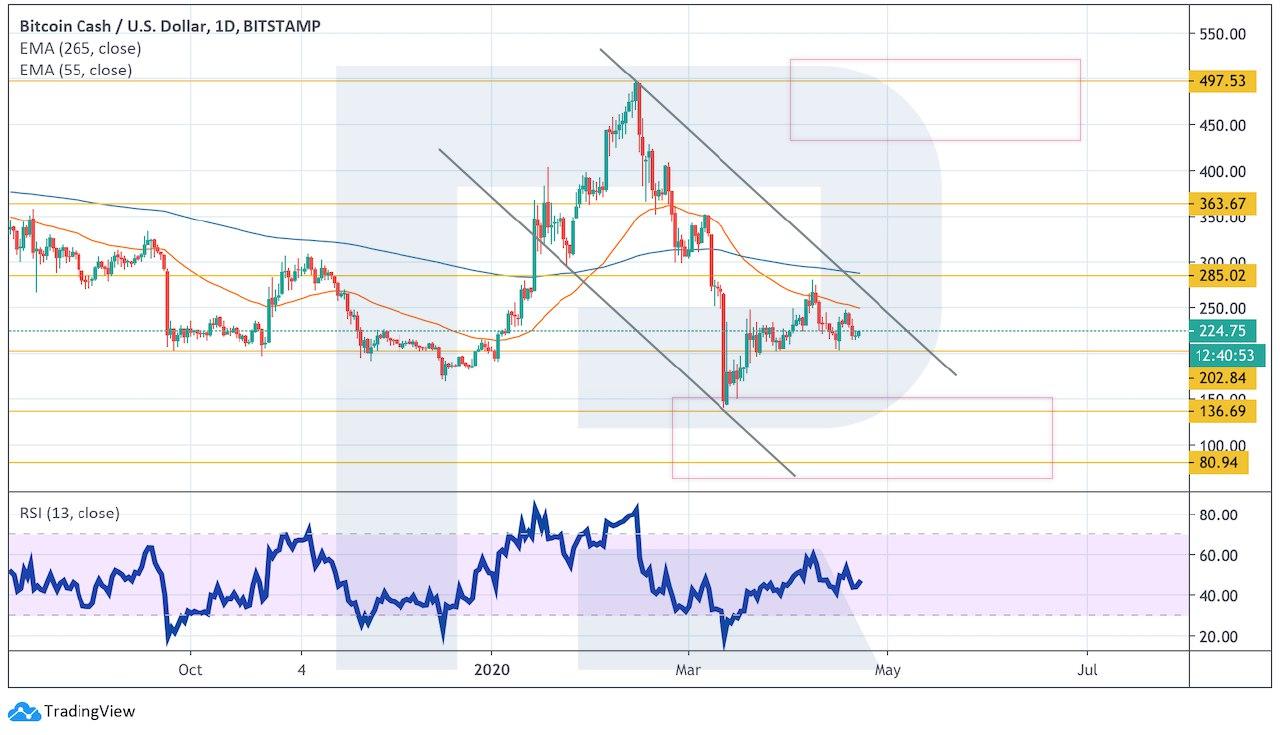
Photo: Roboforex / TradingView
In the H4 chart, the pair is forming a “Head & Shoulders” reversal pattern with the target at $136. To confirm further decline, the price must break the support level and fix below $200. However, if the asset skyrockets and breaks $252, the pattern will be canceled and the instrument will continue growing with the first target at $285.
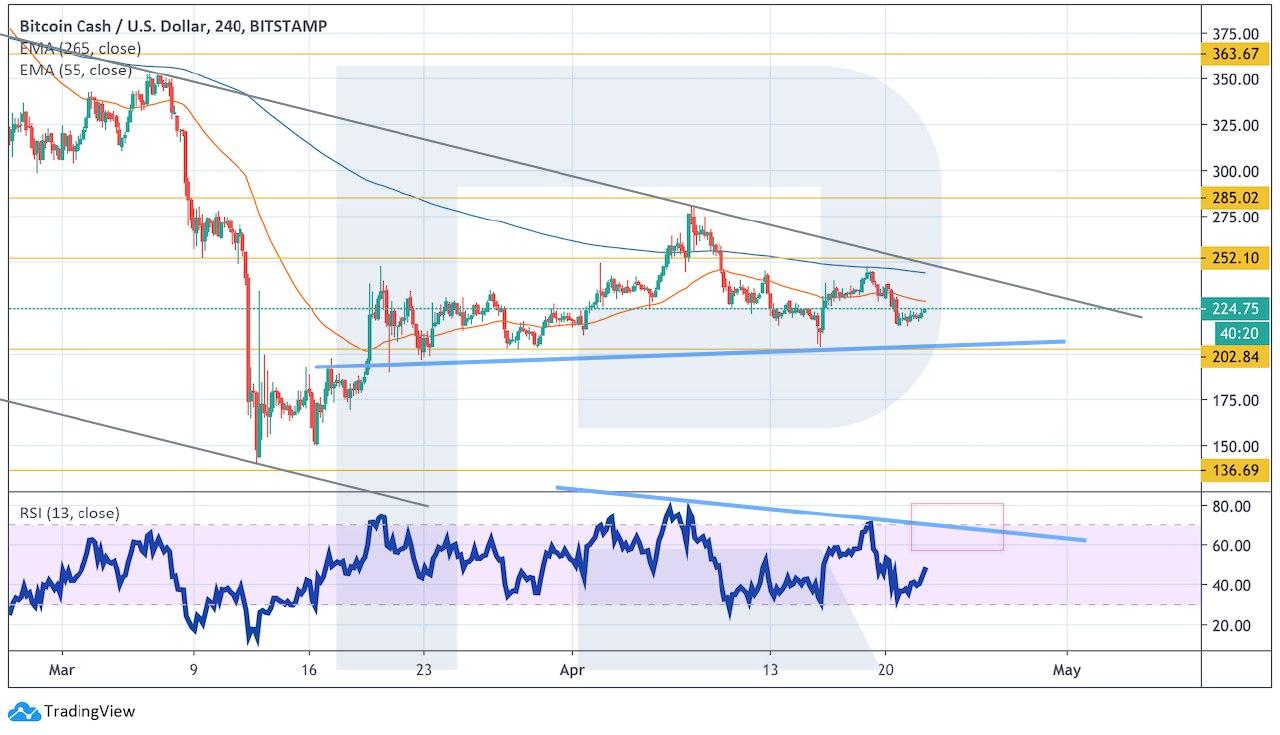
Photo: Roboforex / TradingView
Disclaimer: Coinspeaker is committed to providing unbiased and transparent reporting. This article aims to deliver accurate and timely information but should not be taken as financial or investment advice. Since market conditions can change rapidly, we encourage you to verify information on your own and consult with a professional before making any decisions based on this content.

Dmitriy Gurkovskiy is a senior analyst at RoboForex, an award-winning European online foreign exchange forex broker.


