
Dmitriy Gurkovskiy, a senior analyst at foreign exchange broker RoboForex, provides his vision of the possible tendencies in price changes for Bitcoin as well as for other major cryptos.
However, if bulls are strong enough to rebound from them to the upside, chances for further growth will go up. Moreover, on shorter timeframes, some cryptoassets are forming reversal patterns in favor of further growth, that’s why it will be very important for them to break upside borders of these patterns. Only after that, the cryptocurrency market may start a proper rising movement.
Bitcoin
As we can see in the daily chart, Bitcoin continues trading above the support area at $10,000 but at the same time doesn’t break the resistance area at $11,000. There is some uncertainty from both bulls and bears. On one hand, the above-mentioned support area, which is very important here, managed to “hold ground” and there are chances for further growth of the asset. On the other hand, the unwillingness of bulls to fix above $11,000 may indicate that they aren’t strong enough to continue pushing the cryptocurrency upwards. The RSI indicator is forming a Head & Shoulders reversal pattern, which may hint at a potential growth from the current levels. To confirm further ascending movement, the price and the indicator must break $11,200 and then neckline respectively. However, this bullish scenario may no longer be valid if the asset breaks the support area and fixes below $10,000. In this case, the instrument may continue falling to reach $7,000 where it is expected to complete a bullish “5-0” pattern. If later BTC/USD rebounds from the pattern’s downside border, the market may again attempt to break the local high and then reach $14,000 or even higher.
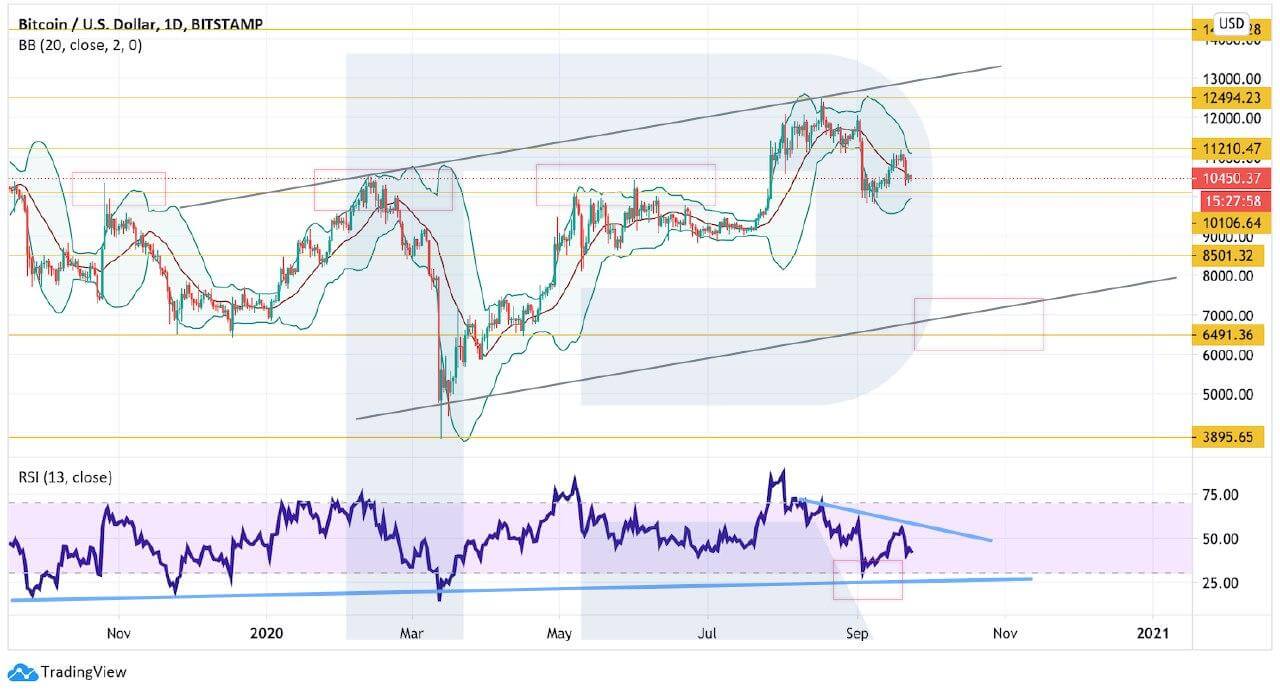
Photo: RoboForex / TradingView
In the H4 chart, there is also a potential for the formation of an Inverted Head & Shoulders reversal pattern. Right now, the asset is forming the Right Shoulder and may start growing from the current levels. To complete the pattern, the price must break the neckline and fix below $10,800. Another signal in favor of this idea is a rebound from 30 at the RSI – as we can see, earlier such decline resulted in the cryptocurrency growth. However, this scenario may no longer be valid if the instrument breaks the local low and fixes below $10,105. After that, the market may continue falling with the targets at $9,500 and $8,975.
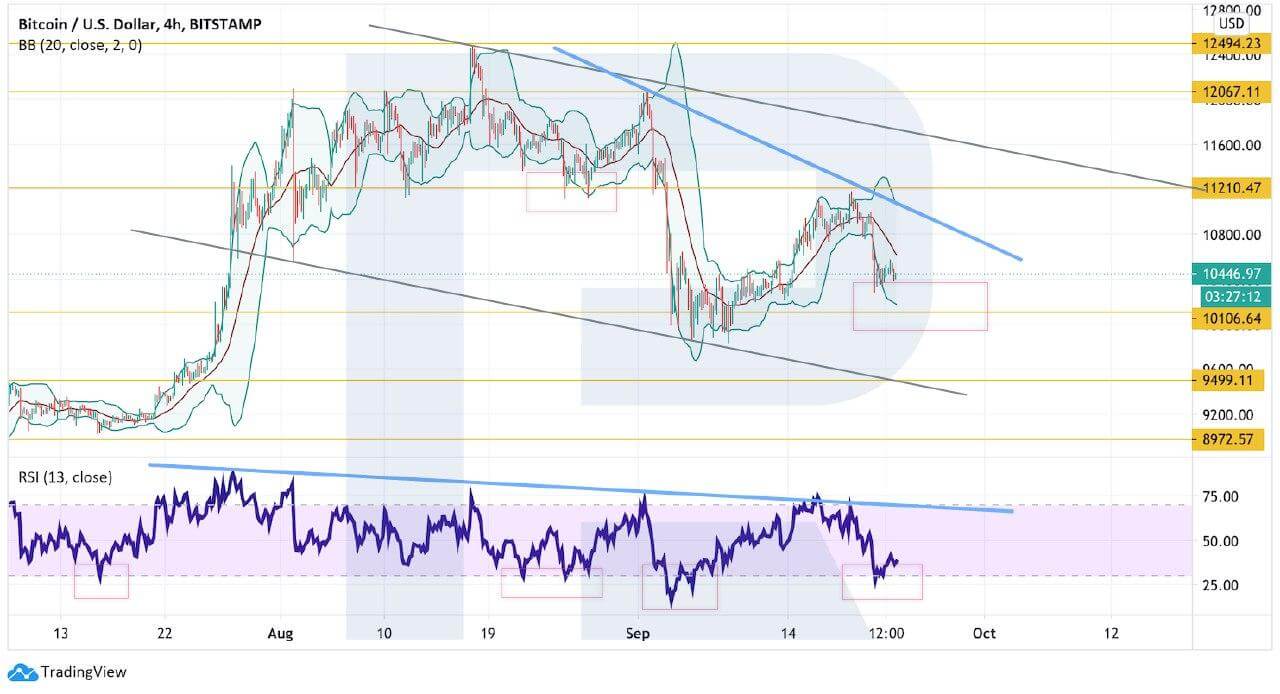
Photo: RoboForex / TradingView
Ethereum
In the daily chart, ETH/USD is still correcting within the rising channel. The current price movement structure looks like a bullish “5-0” pattern, the same as we can see in the BTC/USD chart. However, in the case of Bitcoin, the price has enough room to fall and reach $7,000, while here the asset is moving very close to the pattern’s downside border. That’s why, one shouldn’t exclude a pretty close test of $306 and further growth of Ethereum. An excellent signal in favor of this idea will be a breakout of the descending trendline at the RSI. Moreover, if the price easily breaks the descending channel’s upside border and fixes above $415, the cryptocurrency may resume a proper bullish tendency. Still, this scenario may no longer be valid if the asset breaks the rising channel’s downside border and fixes below $250. In this case, the instrument may continue trading downwards to reach $150 or even break it.
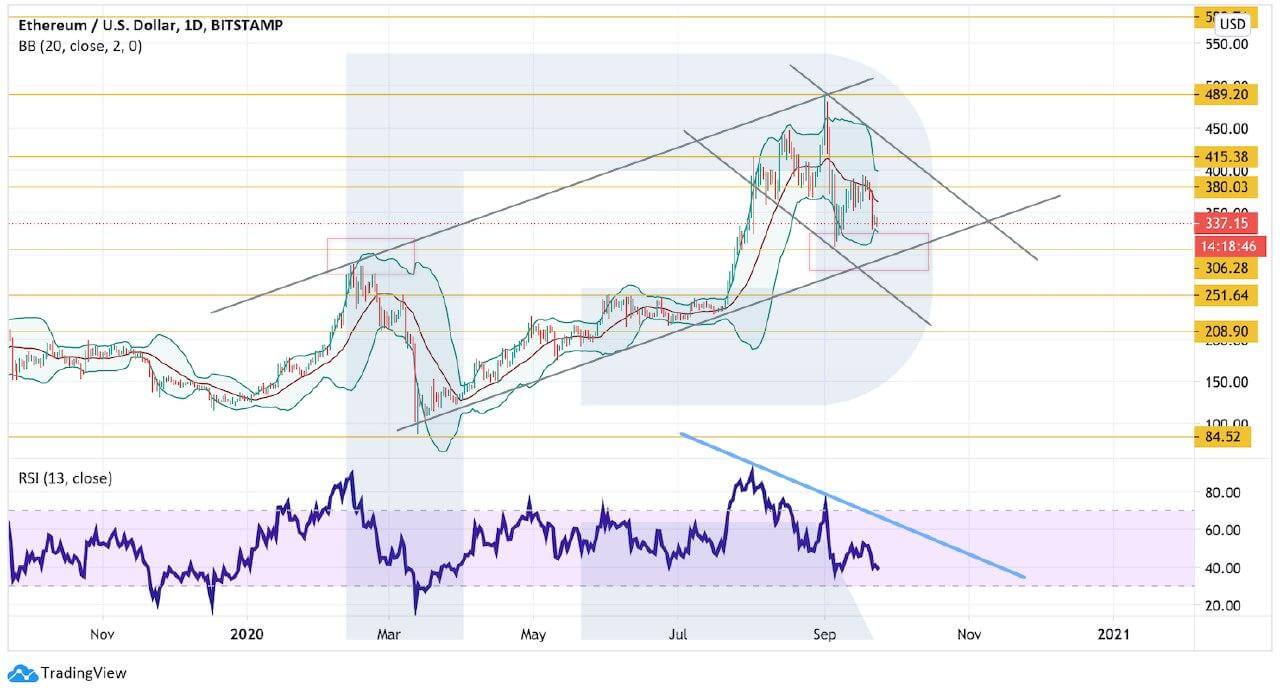
Photo: RoboForex / TradingView
On shorter timeframes, ETH/USD is falling but the current price movement structure may be considered as a Double Bottom reversal pattern. That’s why, after breaking $397, the pair is expected to continue growing towards $490 to complete the pattern. Another signal in favor of this idea is a breakout of 30 at the RSI – earlier, such behavior already indicated the end of descending movements. However, this bullish scenario may no longer be valid if the price breaks the support area and fixes below $300. In this case, the above-mentioned pattern will be canceled and the instrument may continue falling with the target at $250.
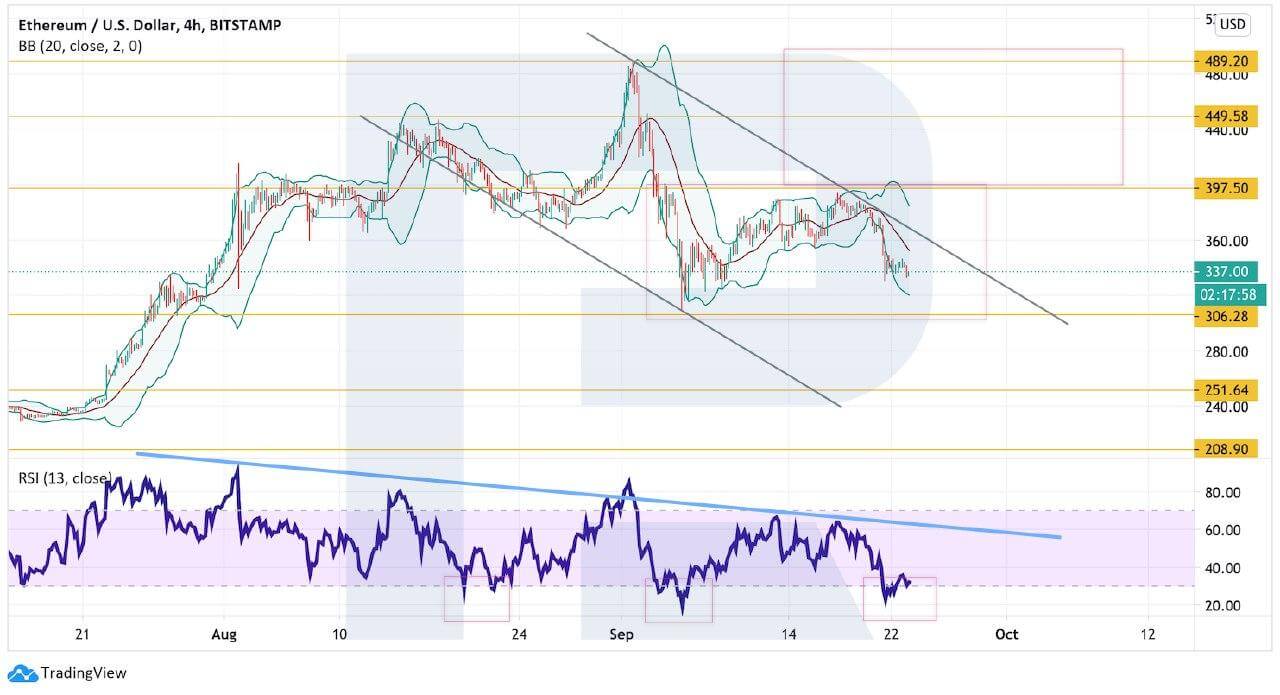
Photo: RoboForex / TradingView
Litecoin
As we can see in the daily chart, Litecoin continues trading above the support area at $39. The current price movement structure still looks like a Head & Shoulders reversal pattern, the Right Shoulders of which is expected to be finished at $51. A lot of authors and enthusiasts of the technical analysis recommend to place buy orders at the moment when such patterns are being formed. However, if the price breaks the support area and fixes below $38, the pattern will be canceled because the neckline will be skewed. On the contrary, if the asset breaks $50-55, it may continue growing to reach $64 and then $76. An excellent signal in favor for further growth will be a breakout of the descending trendline at the RSI.
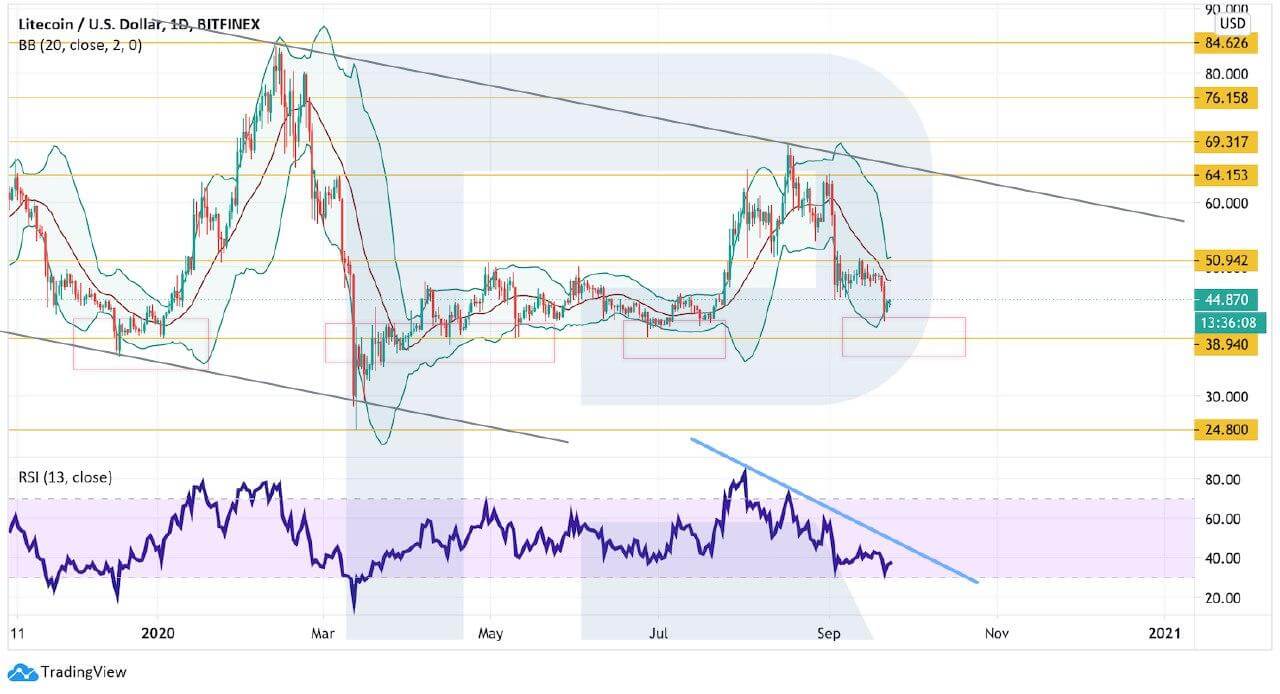
Photo: RoboForex / TradingView
In the H4 chart, there is a potential for the formation of a Wedge pattern. If the asset breaks the pattern’s upside border and fixes above $50, one should consider the pattern materialization with the upside target above $70. A strong signal in favor of this idea will be a breakout of the descending resistance line at the RSI. However, this bullish scenario may no longer be valid if Litecoin breaks the support area and fixes below $39. In this case, one shouldn’t expect the pattern materialization. Instead of this, the instrument may continue falling towards $35 or even lower.
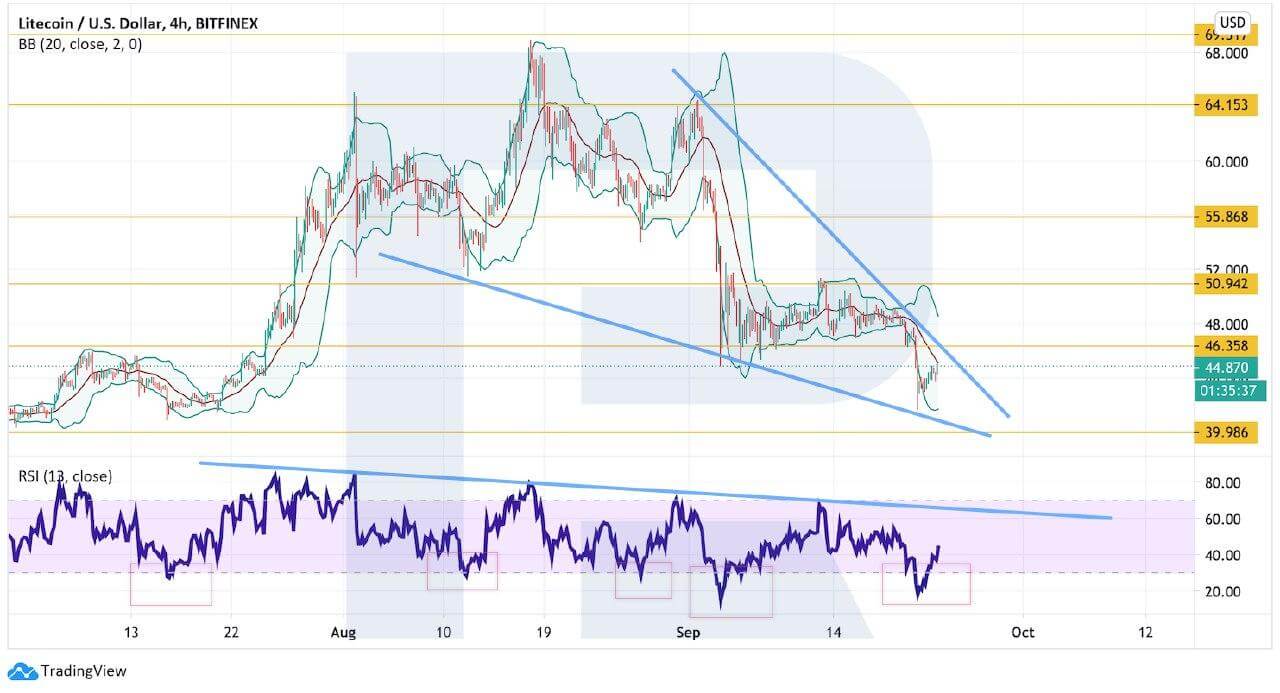
Photo: RoboForex / TradingView
TRON
As we can see in the daily chart, TRON is still moving within the rising channel and also forming a bullish “5-0” pattern, just like in the BTCUSD and Ethereum charts. That’s why, if the price successfully rebounds from the pattern’s downside border, it may continue growing with the predicted target at $0.045. Another signal in favor of this idea is the proximity of the support line at the RSI – the indicator hasn’t tested this line closely but one can see that there is still some room for further decline and a test of the rising channel’s downside border. However, this bullish scenario may no longer be valid if the asset breaks the support area and fixes below $0.021. in this case, the above-mentioned pattern will be canceled and the instrument may continue falling to reach $0.011.
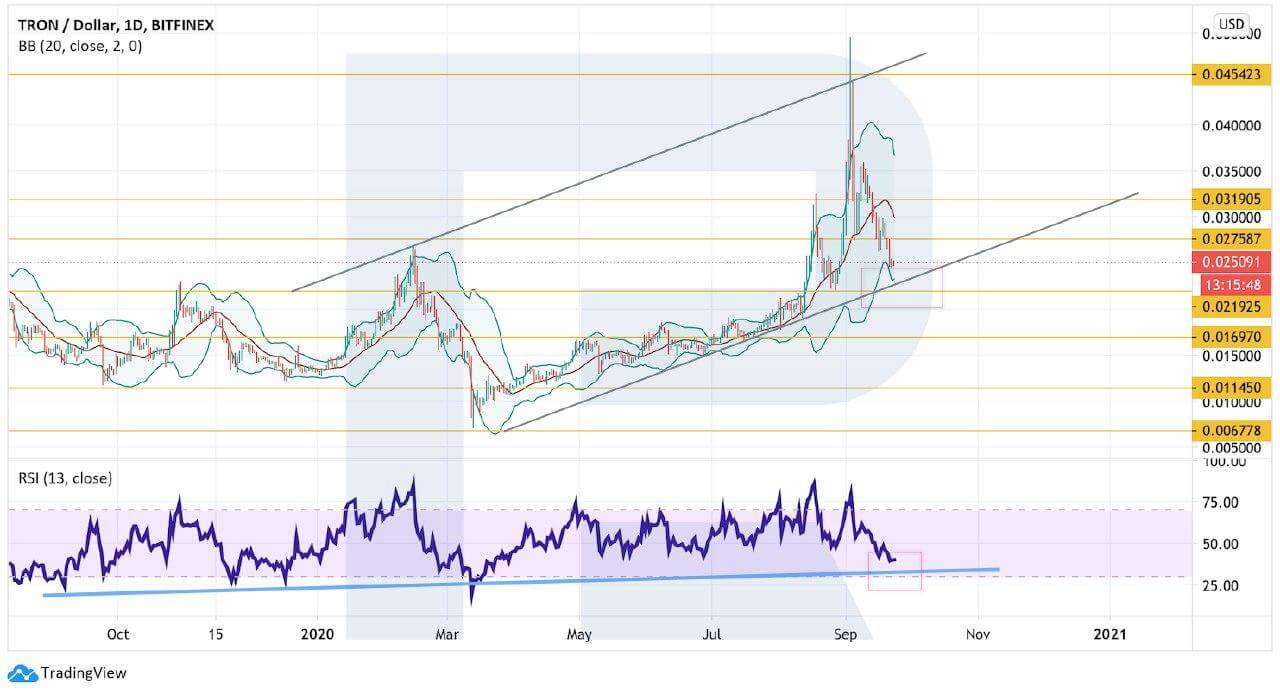
Photo: RoboForex / TradingView
On shorter timeframes, the cryptocurrency is forming a bullish “Wolfe Wave”. The target of the pattern materialization is at $0.030. As we can see, the price hasn’t broken the pattern’s downside border yet, thus indicating a bullish pressure. A god signal in favor of further growth is a breakout of the descending trendline at the RSI. To confirm this scenario, the asset must break the pattern’s upside border and fix above $0.026 – as a rule, a lot of traders increase their positions in this spot. However, this scenario may be canceled if the market breaks the support area and fixes below $0.023.
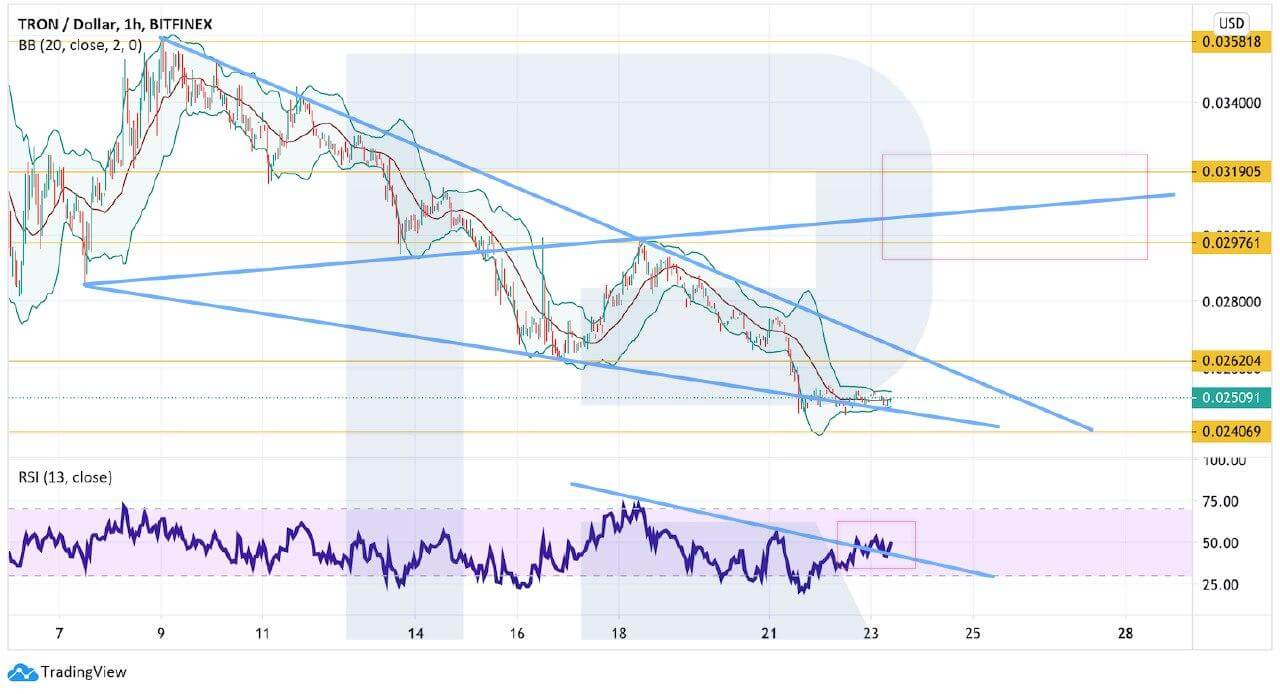
Photo: RoboForex / TradingView
EOS
In the daily chart, EOS is still correcting but bulls are doing a good job in protecting the support area. Moreover, the RSI indicator is once again rebounding from the trendline and there are good chances to see further growth of the price to reach $3.17 or even break it. In this case, the asset may continue trading upwards to reach the descending channel’s upside border at $3.95. However, if the market breaks $2.21, the instrument may continue falling with the target at $1.40.
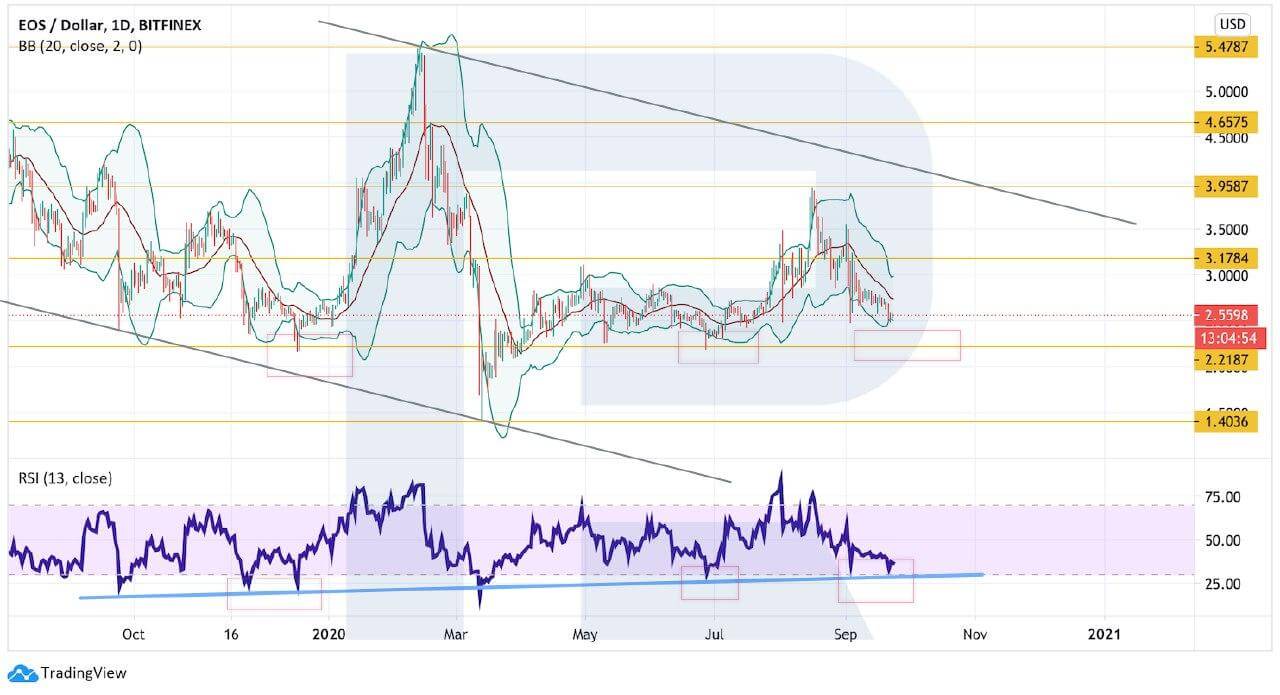
Photo: RoboForex / TradingView
As we can see in the H4 chart, the asset is still falling and forming a Wedge pattern. If the price breaks the pattern to the upside, the cryptocurrency may resume growing towards $3.57 to complete it. To confirm this scenario, the pair must break the resistance area and fix above $2.87. Another signal in favor of this idea may be a breakout of the descending trendline at the RSI. However, this scenario may no longer be valid if the market breaks the support area and fixes below $2.21. After that, the above-mentioned pattern will be canceled and the instrument may continue falling to reach $1.70.
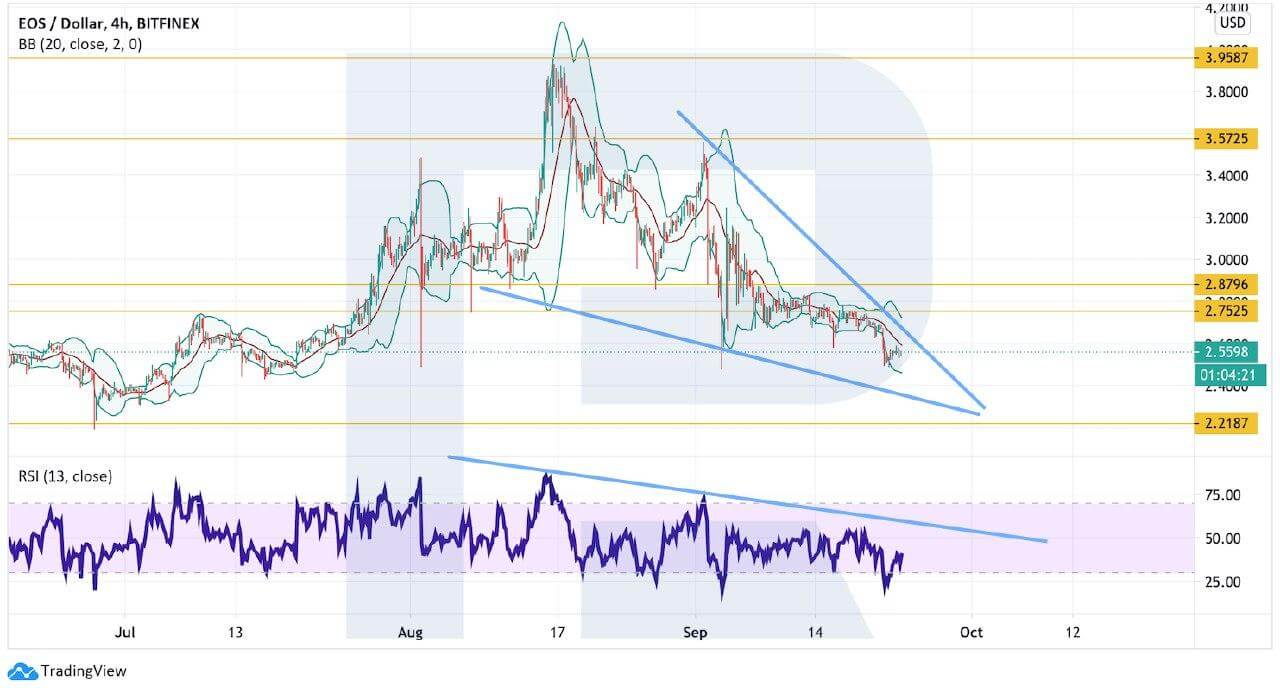
Photo: RoboForex / TradingView
For this article, we’ve used the graphs provided by TradingView.
Disclaimer: Coinspeaker is committed to providing unbiased and transparent reporting. This article aims to deliver accurate and timely information but should not be taken as financial or investment advice. Since market conditions can change rapidly, we encourage you to verify information on your own and consult with a professional before making any decisions based on this content.

Dmitriy Gurkovskiy is a senior analyst at RoboForex, an award-winning European online foreign exchange forex broker.


