Ether Price Tanks Below $3,800 as Analysts Warn of Deeper Correction Before Next Rally
Ethereum slipped below $3,800 after a 7% daily drop, with analysts warning of a potential drop to $3,600 and even to $3,400 if the sell-off accelerates.
Spot ETH ETFs have seen $80 million in net outflows this week so far.
Ethereum BTC$68 18824h volatility:3.9%Market cap:$1.36 TVol. 24h:$46.27 B
is struggling to find a footing after breaking below the $3,800 support level, currently trading near $3,719 after a sharp 7% daily decline. The move comes amid rising exchange inflows and heavy selling pressure, with analysts expecting further downside before a meaningful recovery.
Crypto analyst Ted believes ETH could retest the $3,600 region, calling it the next strong support zone. He added that the second-largest cryptocurrency must reclaim the $4,000 “soon” to regain momentum.
This was echoed by trader Merlijn, who noted that Wintermute, a major market maker, had been sending millions in BTC, ETH, and SOL to exchanges on October 17. Notably, the last time they did this, the market saw a major dump. “Pray for your bags,” he writes.
🚨ALERT:
WINTERMUTE IS SENDING MILLIONS IN $BTC, $ETH, AND $SOL TO EXCHANGES.
Adding to the pressure, spot ETH ETFs recorded net outflows of around $80 million so far this week, with $56.8 million leaving on Oct. 16 alone. Institutional sentiment appears to be cooling, at least in the short term, as investors await fresh catalysts to confirm the bullish move.
Technical analyst Heisenberg pointed out that ETH currently remains in a “neutral zone” between $3,800 and $4,100, which it has retested multiple times in the past year. He also noted that the cryptocurrency has been trading above a major support trendline since late 2022.
$ETH Bulls need to hold the notable blue support trendline, break out of the green "neutral zone" with conviction, go back and retest that obvious $4,900-$5,000 mark and not look back after that.
According to the analyst, bulls need to defend this support line and break above $4,900–$5,000, making ETH the best crypto to buy right now. However, he warned that a decisive drop below this line could drag prices toward $3,400, a level that flashed during last week’s mini crash.
What’s Next for Ether Price?
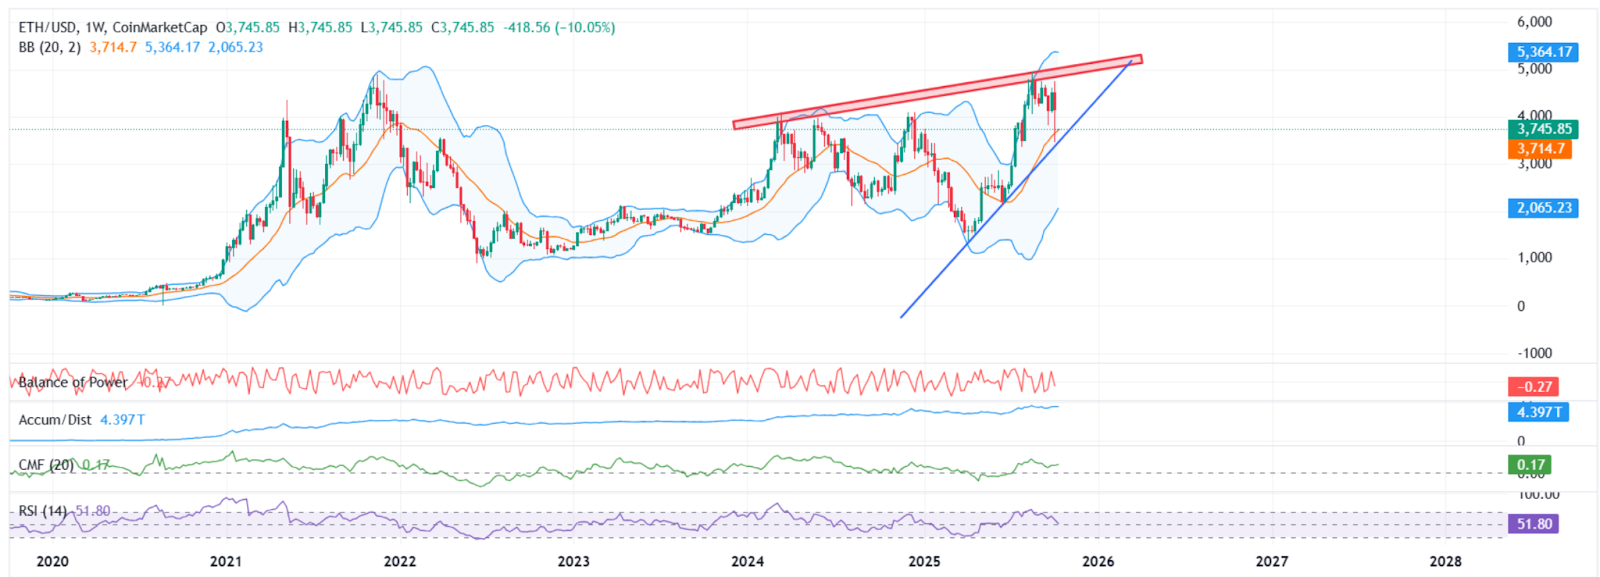
On the weekly chart, ETH is currently forming a rising wedge pattern, often considered a bearish setup if the volume is low. Moreover, Bollinger Bands indicate tightening volatility, implying that a larger directional move is near.
ETH weekly price chart with momentum indicators | Source: TradingView
The RSI is also signaling weakening momentum but not yet oversold conditions. The price action suggests ETH may consolidate or dip toward $3,600 before finding support. A rebound from this level could lead to another test of $4,000.
Popular analyst Satoshi Stacker noted on X that ETH’s MACD has flipped red on the weekly chart. He added that if confirmed at the weekly close on October 12, it historically leads to a pattern of a drop, a bounce, and then another deeper decline.
ETH's MACD has flipped red on the weekly timeframe. If this signal is confirmed at the weekly close, it historically leads into a pattern of a drop, a bounce, and then a further drop with losses ranging from -18% to -80%. pic.twitter.com/LFlojYHzrC
Disclaimer: Coinspeaker is committed to providing unbiased and transparent reporting. This article aims to deliver accurate and timely information but should not be taken as financial or investment advice. Since market conditions can change rapidly, we encourage you to verify information on your own and consult with a professional before making any decisions based on this content.
A crypto journalist with over 5 years of experience in the industry, Parth has worked with major media outlets in the crypto and finance world, gathering experience and expertise in the space after surviving bear and bull markets over the years. Parth is also an author of 4 self-published books.