Ethereum Price Analysis: ETH/USD Breakout is Highly Anticipated
In case the Bulls gain enough momentum to push up Ethereum price and break the upper trend line of the triangle and sustain the momentum, the ETH price may reach $149 – $161; otherwise, the bearish breakout will target $134.
By Azeez Mustapha
Updated
2 mins readPhoto: Tim Reckmann / Flickr
Key Highlights:
The Bulls’ momentum was lost at the $149 Ethereum price level;
the break out from the descending triangle is imminent;
consolidation is ongoing on the 1-hour chart.
ETH/USD Medium-term Trend: Ranging
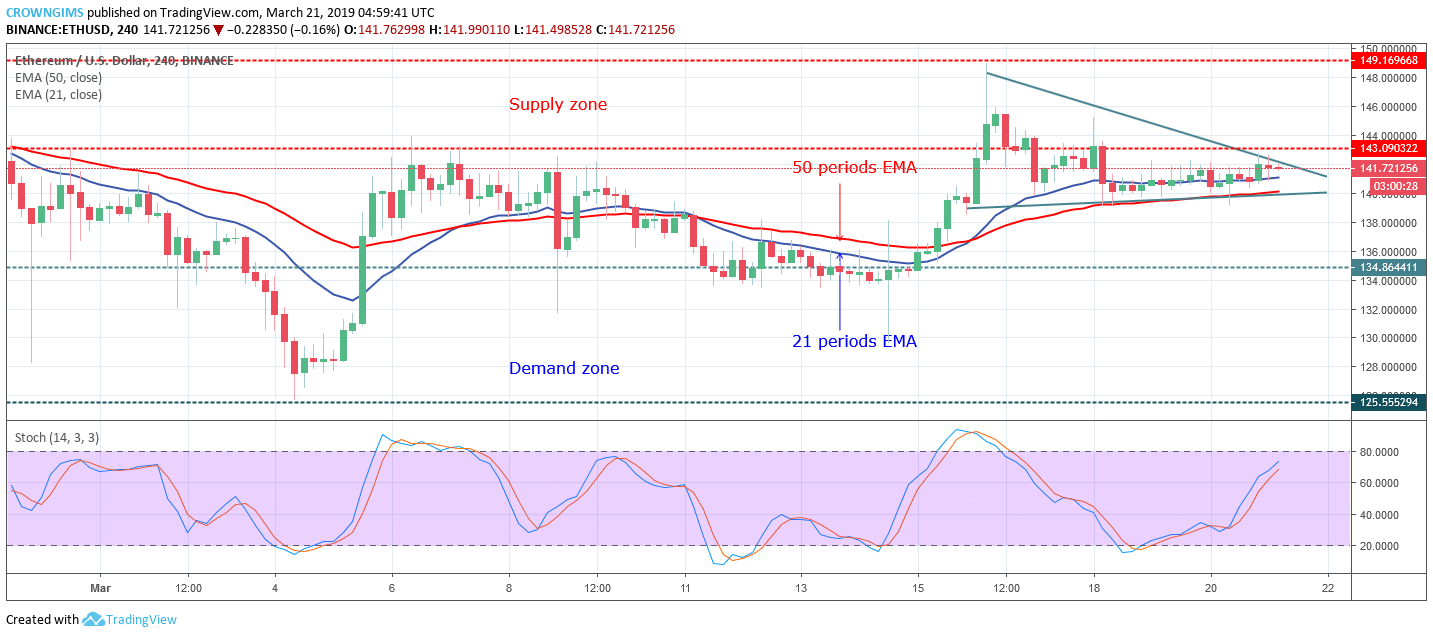
Supply Zones: $143, $149, $161
Demand Zones: $134, $125, $113ETH/USD started ranging phase on the medium-term outlook. The bullish momentum that broke up the supply zone of $143 and propelled Ethereum price to reach the supply zone of $149 was not enough to break up the zone. In other words, the Bulls lost the momentum at the $149 price level. The Bears pushed down the ETH price below $143 price level where it is currently consolidating.
The descending triangle pattern is noticed on the 4-hour chart. Ethereum price is trading on the 21 periods, EMA and 50 periods EMA and the two EMAs close to each other confirm the consolidation in the ETH market. However, the Stochastic Oscillator period 14 is above 60 levels with the signal lines pointing up to indicate the buy signal.
In case the Bulls gain enough momentum to push up the ETH price and break the upper trend line of the triangle and sustain the momentum, Ethereum price may reach $149 – $161. Alternatively, should the $143 price level holds, there will be a bearish break out at the lower trend line of the triangle and the target will be $134.
ETH/USD Short-term Trend: Ranging
On the medium-term outlook, ETH price is ranging. The bears moved into the market immediately the bullish trend was resisted at the $149 price level. A bearish reversal candle pattern formed that is called inside the bar, followed by more bearish candles which push the coin below $143 price level. Descending triangle pattern also formed on the 1-hour chart. The break out is imminent.
The 21 periods EMA and 50 periods EMA are interlocked to each other with the Ethereum price hovering on the EMAs. The Stochastic Oscillator period 14 is at 60 levels with the signal lines pointing down to indicate sell signal.
Azeez Mustapha is a specialist in Computer Studies (including DTP), Forex and Crypto trading professional. Being expert technical and currency analyst, as well as experienced fund manager and author of several books, Azeez places strong focus on crypto market studies conducting comprehensive price analyses and sharing forecasts of presumptive market trends.

 ETH/USD started ranging phase on the medium-term outlook. The bullish momentum that broke up the supply zone of $143 and propelled Ethereum price to reach the supply zone of $149 was not enough to break up the zone. In other words, the Bulls lost the momentum at the $149 price level. The Bears pushed down the ETH price below $143 price level where it is currently consolidating.
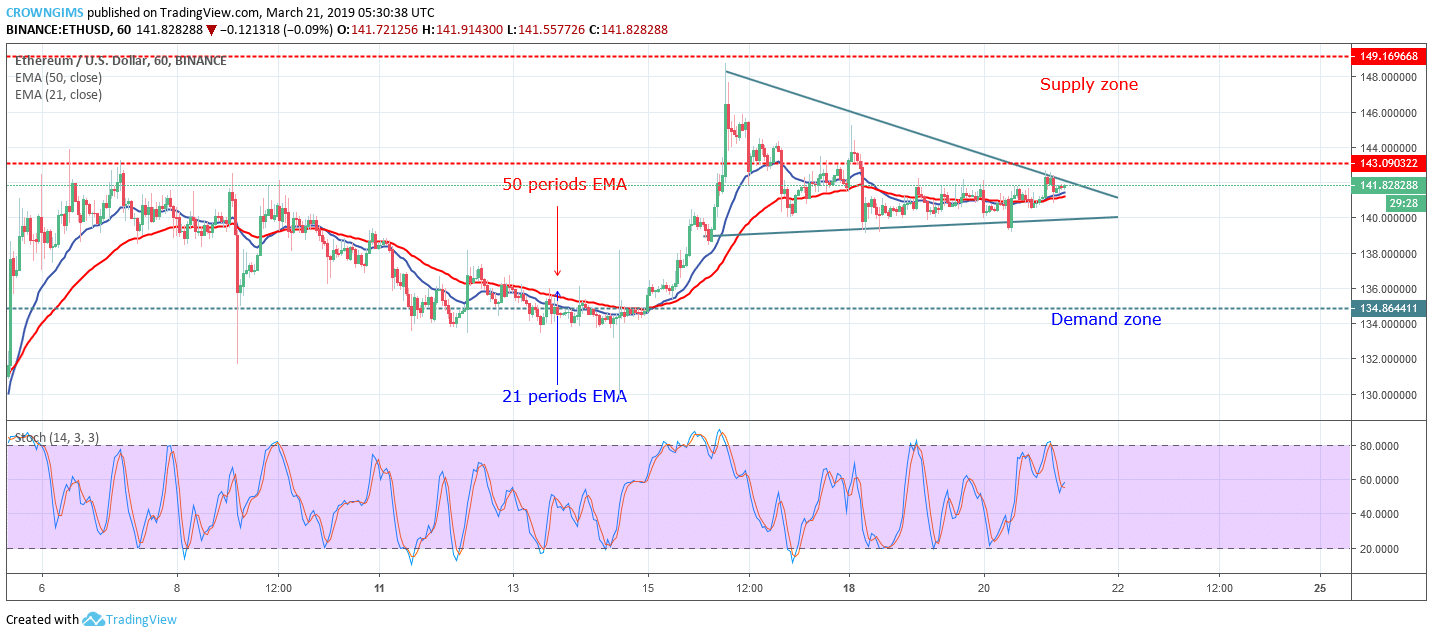 On the medium-term outlook, ETH price is ranging. The bears moved into the market immediately the bullish trend was resisted at the $149 price level. A bearish reversal candle pattern formed that is called inside the bar, followed by more bearish candles which push the coin below $143 price level. Descending triangle pattern also formed on the 1-hour chart. The break out is imminent.


