Ethereum Price Analysis: ETH/USD Trends of December 11–17
Ethereum price is fluctuating above the $79 price level, price breakout is imminent. In case the bullish candle penetrates the supply level of $103 and close above it, $157 price level may be its target.
By Azeez Mustapha
Updated
2 mins readPhoto: Shutterstock
the price may target $157 price level as its high;
the bearish trend may continue in the ETH market.
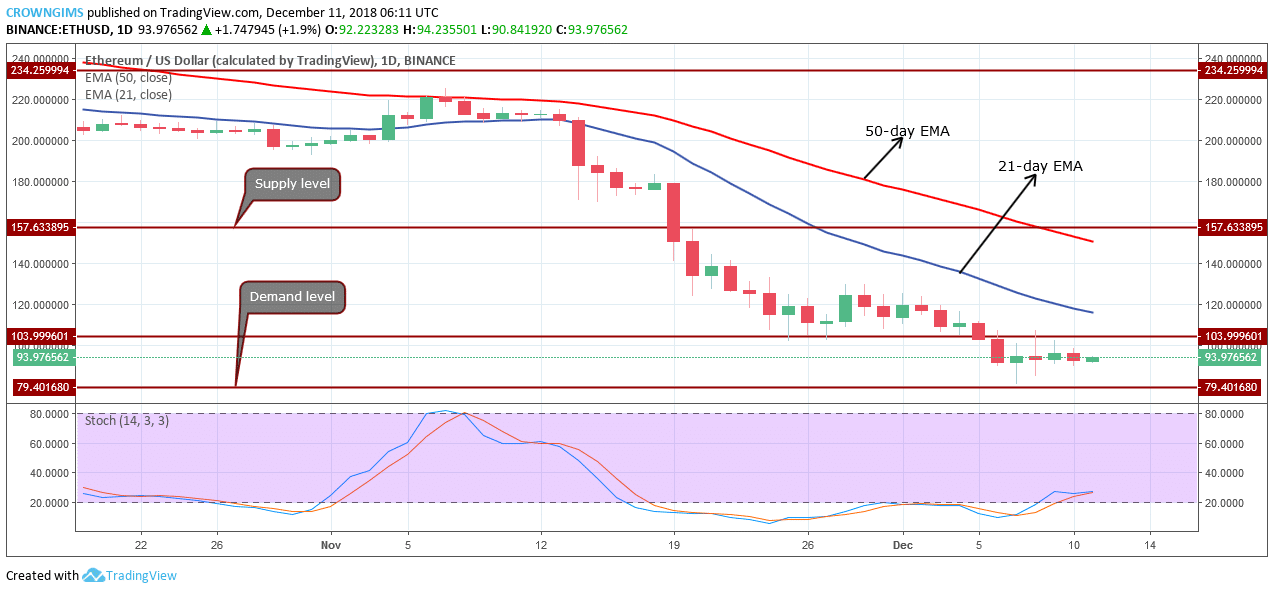
ETH/USD Long-term Trend: Bearish
Supply levels: $103, $131, $157
Demand levels: $79, $60, $47ETH has been on bearish trend on the long-term outlook for more than three weeks. Last week was not exempted. Ethereum price reached its high of $131 last week and began to fluctuating between the supply level of $131 and the demand level of $103. On December 5, a bearish pressure pushed the ETH price to break below the demand level of $103 bottomed at $79. Further decrease in ETH price was rejected and it leads to price consolidation.
Today, Ethereum price is fluctuating above the $79 price level, price breakout is imminent. In case the bullish candle penetrates the supply level of $103 and close above it, $157 price level may be its target. On the other hand, in case a bearish momentum breaks the $79 price level downside, the coin will find its low at $60 demand level.
ETH price is below 20-day EMA and the 50-day EMA, which indicates that the crypto is in a bearish trend. The Stochastic Oscillator period 14 is above 20 levels which indicates a bullish momentum and buy signal.
ETH/USD Medium-term Trend: Bearish
ETH/USD was in a bearish trend on the medium-term outlook. The coin found its low at $79 price level last week, consolidated for few hours before a bullish pressure pushed it up towards $103 price level but resisted by the dynamic resistance of 21-day EMA.
Later the Ethereum price was in a sideways movement below and above the 21-day EMA and 50-day EMA. Currently, ETH is below the two EMAs indicating that ETH price is likely to fall. The Stochastic Oscillator period 14 is at the 40 regions with the signal lines closed together indicating that ETH price is in the sideways territory.
Azeez Mustapha is a specialist in Computer Studies (including DTP), Forex and Crypto trading professional. Being expert technical and currency analyst, as well as experienced fund manager and author of several books, Azeez places strong focus on crypto market studies conducting comprehensive price analyses and sharing forecasts of presumptive market trends.

 ETH has been on bearish trend on the long-term outlook for more than three weeks. Last week was not exempted. Ethereum price reached its high of $131 last week and began to fluctuating between the supply level of $131 and the demand level of $103. On December 5, a bearish pressure pushed the ETH price to break below the demand level of $103 bottomed at $79. Further decrease in ETH price was rejected and it leads to price consolidation.
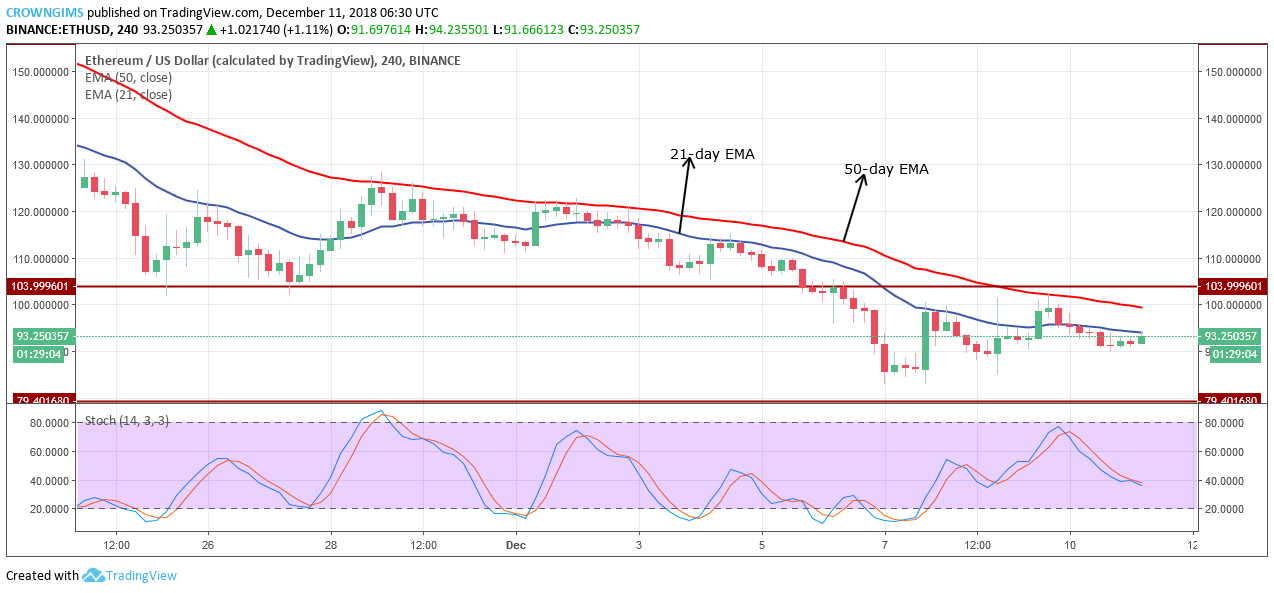 ETH/USD was in a bearish trend on the medium-term outlook. The coin found its low at $79 price level last week, consolidated for few hours before a bullish pressure pushed it up towards $103 price level but resisted by the dynamic resistance of 21-day EMA.


