Ethereum Price Analysis: ETH/USD Trends of December 25–31
In case the bearish pressure continues and there is a bearish engulfing candle breakout and close below the demand level of $121, then Ethereum may have its low at $98 – $109.
By Azeez Mustapha
Updated
3 mins readPhoto: QuoteInspector
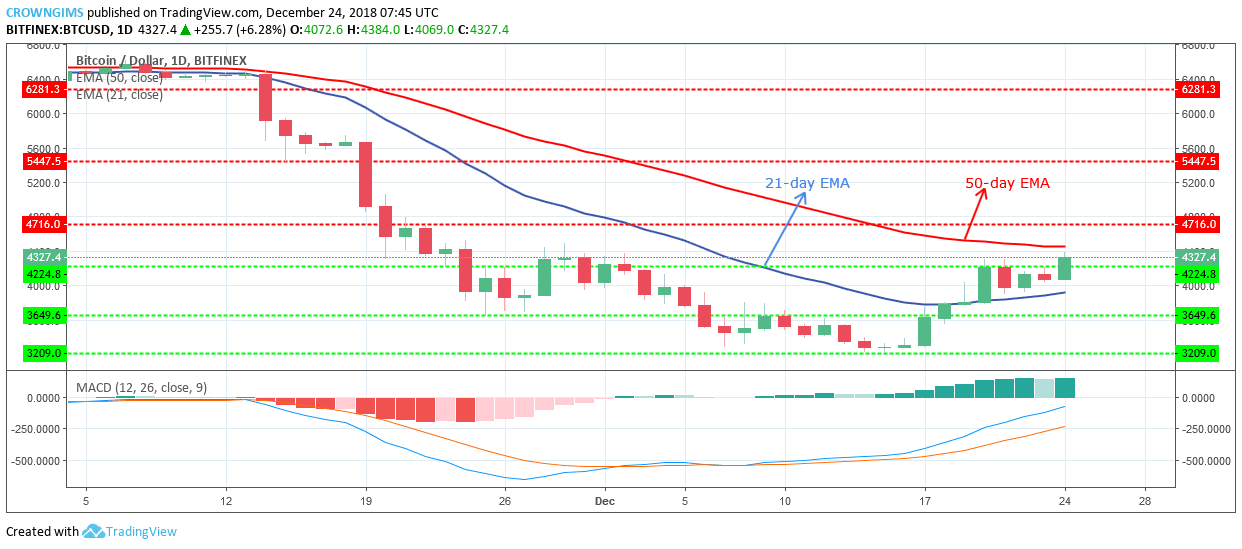
ETH is in its bullish trend on the long-term outlook. Last week, the cryptocurrency found its support at the demand level of $79. A bullish engulfing candle formed at this demand level made the bulls succeed in breaking up the former supply level of $109 and the coin rallied to the north and the last week target was met as predicted. The demand level of $79 serves as a turning point for the coin. Several barriers were broken to the upside including the dynamic support and resistance.
The bulls have taken over the ETH market as the bullish momentum increases with more strong bullish candles coming up and placed the coin above the 50-day EMA while the 21-day EMA is below which indicates that bullish momentum is increasing. The coin reached the high of $164 where the further increase was rejected and Ethereum price retraced to the broken level.
All indicators confirm the continuity of bullish trend on the daily charts; the MACD period 12 with its histogram above the zero levels and the signal line pointing to the north which connotes buy signal. Currently, the 21-day EMA is moving closer to 50-day EMA in order to cross upside.
After the price correction which is ongoing, the ETH price may resume its bullish move and may have its target at $182 price level.
ETH/USD Medium-term Trend: Bullish
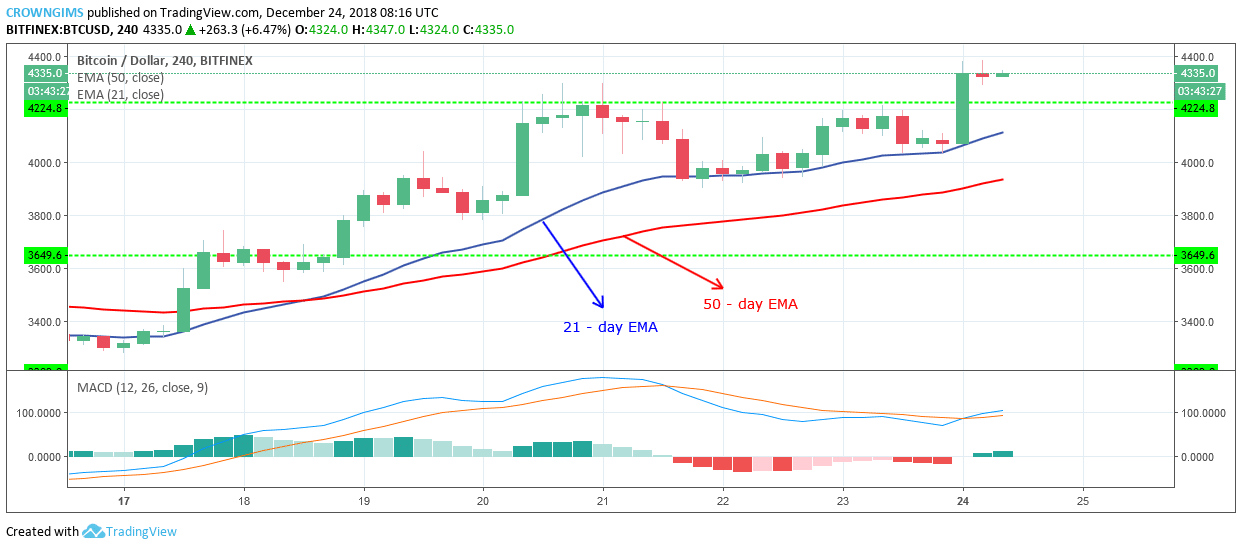
On the medium-term outlook, ETH/USD is in a bullish trend. The bullish trend continues on the 4-Hour chart as the ETH price is making higher highs on the chart. The 21-day EMA has crossed the 50-day EMA upside as evidence of uptrend and the domination of the bulls on the ETH market.
Yesterday, Ethereum price topped at $164 supply level and the bears defended the level by pushing the ETH price down by the formation of gravestone Doji candle followed by bearish candles, broken downside the former demand levels of $146 and $131.
In case the bearish pressure continues and there is a bearish engulfing candle breakout and close below the demand level of $121, then Ethereum may have its low at $98 – $109. Meanwhile, the MACD with its histogram is below zero and the signal lines point down connotes sell signal.
Azeez Mustapha is a specialist in Computer Studies (including DTP), Forex and Crypto trading professional. Being expert technical and currency analyst, as well as experienced fund manager and author of several books, Azeez places strong focus on crypto market studies conducting comprehensive price analyses and sharing forecasts of presumptive market trends.

 On the medium-term outlook, ETH/USD is in a bullish trend. The bullish trend continues on the 4-Hour chart as the ETH price is making higher highs on the chart. The 21-day EMA has crossed the 50-day EMA upside as evidence of uptrend and the domination of the bulls on the ETH market.


