Ethereum Price Analysis: ETH/USD May Break Down $242 Level and Target $227
Ethereum price is directly on the demand level of $242, should the Bulls exert pressure to break down the level and the 4-hour candle closes below the level, $227 demand level may be the target.
By Azeez Mustapha
Updated
2 mins readPhoto: QuoteInspector
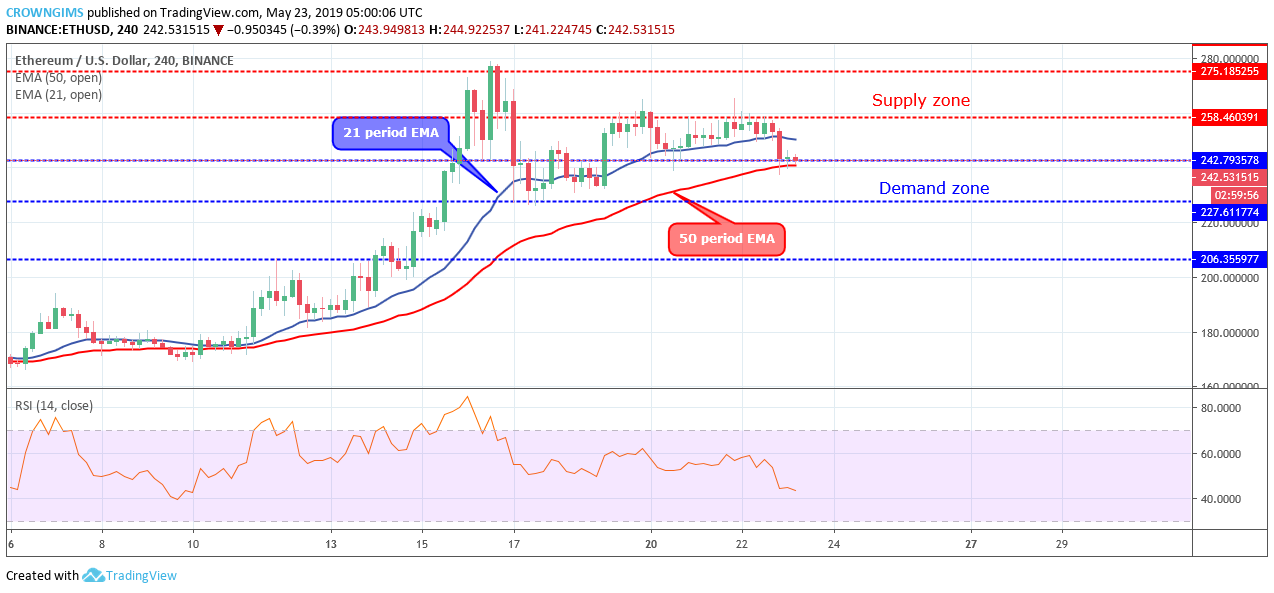
Supply Zones: $258, $275, $287
Demand Zones: $242, $227, $206Ethereum continues sideways movement on the medium-term outlook. There was no significant movement in the Ethereum market for three days. On May 21, the Bulls tried to break up the supply zone of $258 but were resisted by the Bears. Yesterday, a bearish candle emerged to break down the demand zone of $242; it was prevented by the Bears. Ethereum price remains range-bound within the demand zone of $242 and the supply zone of $258. Radical fundamental events may be required to make the coin rally.
ETH price is directly on the demand level of $242, should the Bulls exert pressure to break down the level and the 4-hour candle closes below the level, $227 demand level may be the target. In case the Bulls defend the demand level of $242 again, consolidation may continue within the range.
However, the crypto is found trading in between the 21 periods EMA and 50 periods EMA and the Relative Strength Index period 14 is at 40 levels with the signal lines bend down to indicates sell signal.
ETH/USD Short-term Trend: Bearish
ETH price is bearish on the short-term outlook. Last week, Ethereum was on the ranging mode on the 1-hour chart. The pressure of the Bears was increased and Ethereum price decreased, the coin is currently breaking the barrier at $242, in case the current candle closes below the level, then $227 demand level may be reached. The two EMAs have penetrated downside and the coin trading below the 21 periods EMA and 50 periods EMA.
The 21 periods EMA has crossed the 50 periods EMA as a bearish momentum sign. The Relative Strength Index period 14, is above 30 levels with the signal line pointing down to indicate a sell signal.
Azeez Mustapha is a specialist in Computer Studies (including DTP), Forex and Crypto trading professional. Being expert technical and currency analyst, as well as experienced fund manager and author of several books, Azeez places strong focus on crypto market studies conducting comprehensive price analyses and sharing forecasts of presumptive market trends.

 Ethereum continues sideways movement on the medium-term outlook. There was no significant movement in the Ethereum market for three days. On May 21, the Bulls tried to break up the supply zone of $258 but were resisted by the Bears. Yesterday, a bearish candle emerged to break down the demand zone of $242; it was prevented by the Bears. Ethereum price remains range-bound within the demand zone of $242 and the supply zone of $258. Radical fundamental events may be required to make the coin rally.
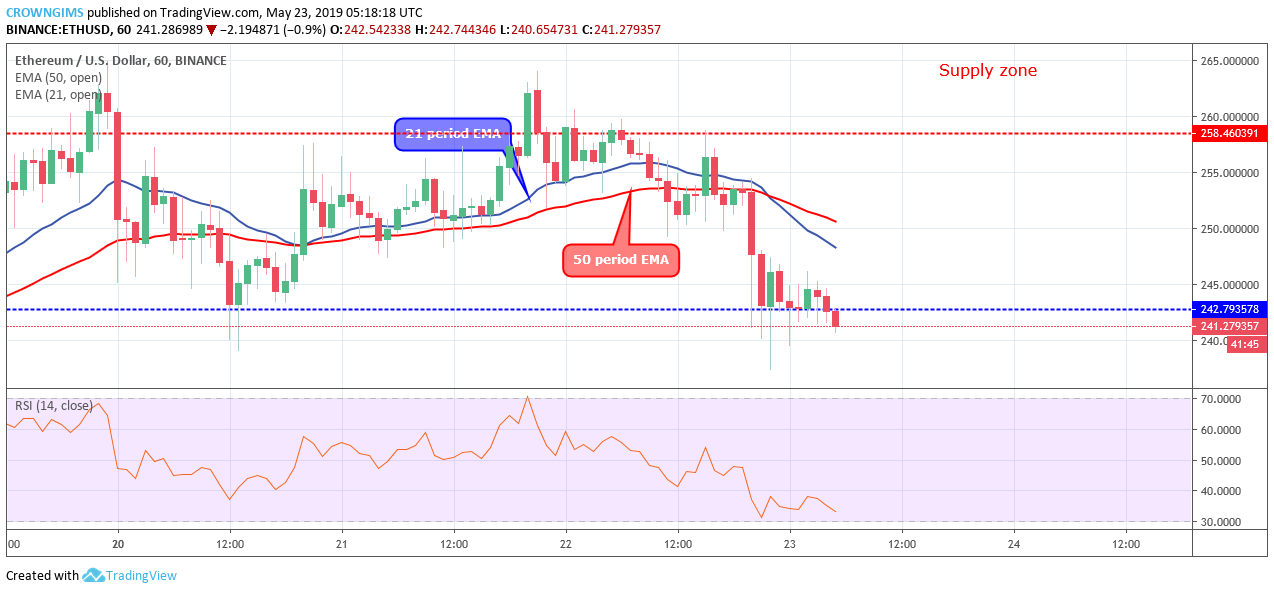 ETH price is bearish on the short-term outlook. Last week, Ethereum was on the ranging mode on the 1-hour chart. The pressure of the Bears was increased and Ethereum price decreased, the coin is currently breaking the barrier at $242, in case the current candle closes below the level, then $227 demand level may be reached. The two EMAs have penetrated downside and the coin trading below the 21 periods EMA and 50 periods EMA.


