Ethereum Price Analysis: ETH/USD Trends of February 05–11, 2019
In case the bears defend the $115 supply level, then Ethereum price may further decline and find its support at $85 after the $101 price level is broken.
By Azeez Mustapha
Updated
2 mins readPhoto: QuoteInspector
Key Highlights:
The bears were still in control of the Ethereum market;
the price may decline further in case bears’ momentum increases;
ETH price resumed another consolidation.
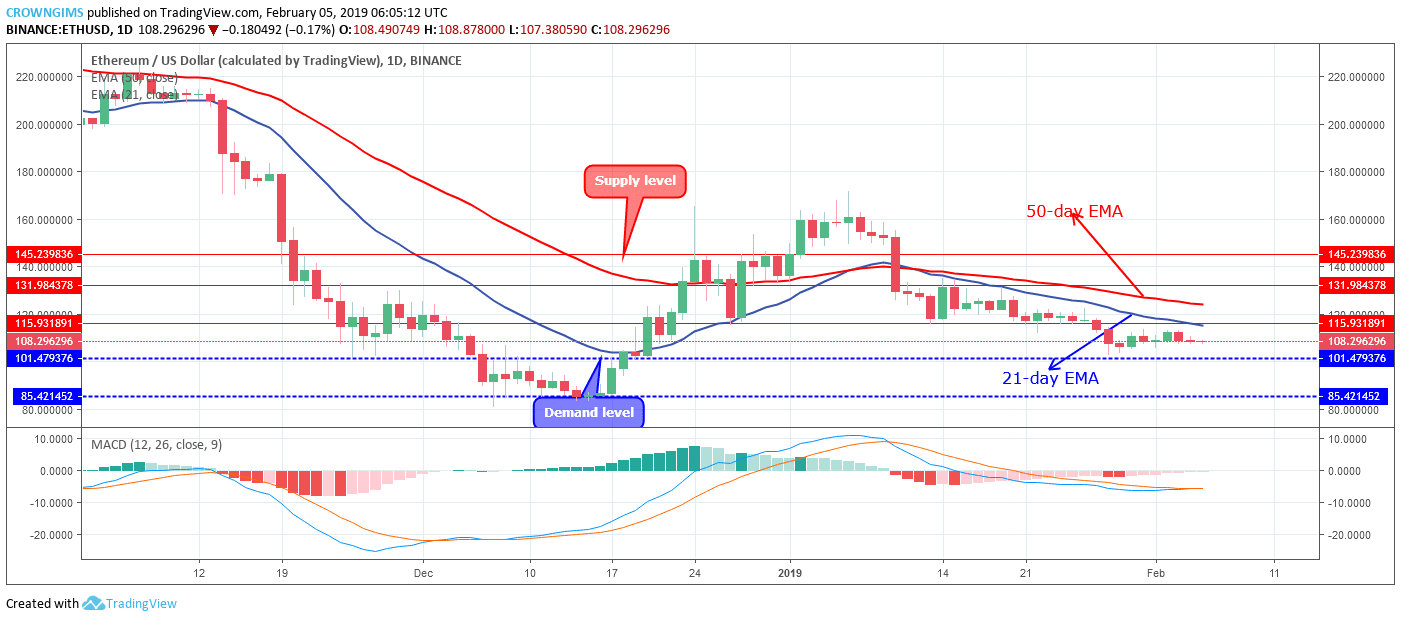
ETH/USD Long-term Trend: Ranging
Supply levels: $115, $131, $146
Demand levels: $101, $85, $74ETH/USD is on the consolidation mode on the long-term outlook. Immediately after the ETH price broke down the demand level of $115 the bears’ momentum was weakened and could not push Ethereum price down further, then the last week anticipated level could not be reached. Likewise, the bulls were unable to gain pressure that will make the ETH price rally to the north. Ethereum price started consolidating within the range of $115 supply level and $101 demand level throughout last week.
Although, the 21-day EMA still remains below the 50-day EMA as a sign of downtrend and the ETH price is trading below the 21- day EMA but the coin is ranging at the same level of the market. The Moving Average Convergence Divergence {MACD) period 12, with its histogram is flat on the zero levels and the signal lines joined together and horizontally flat below the zero levels indicates that consolidation is ongoing and may continue for short period of time.
In case the bears defend the $115 supply level, then Ethereum price may further decline and find its support at $85 after the $101 price level is broken.
ETH/USD Medium-term Trend: Ranging
ETH price is ranging on the 4-Hour chart. The Bearish momentum made the ETH/USD found its support at $101 demand level on the 4-hour chart on January 28 with the formation of Doji candle followed by bullish candles that drove Ethereum upward towards the dynamic support and resistance where it started fluctuating in between and around the two EMAs.
The two EMAs are coming closer to each other with the coin trading directly on the 21-day EMA and 50-day EMA which indicates that the consolation is ongoing in the ETH market. The MACD period 12 with its histogram is on the zero levels and the signal lines horizontally flat on the zero level which confirms the consolidation mode on the 4-hour chart. The ETH bullish break out at the supply level of $115 will have its target at $131.
Azeez Mustapha is a specialist in Computer Studies (including DTP), Forex and Crypto trading professional. Being expert technical and currency analyst, as well as experienced fund manager and author of several books, Azeez places strong focus on crypto market studies conducting comprehensive price analyses and sharing forecasts of presumptive market trends.

 ETH/USD is on the consolidation mode on the long-term outlook. Immediately after the ETH price broke down the demand level of $115 the bears’ momentum was weakened and could not push Ethereum price down further, then the last week anticipated level could not be reached. Likewise, the bulls were unable to gain pressure that will make the ETH price rally to the north. Ethereum price started consolidating within the range of $115 supply level and $101 demand level throughout last week.
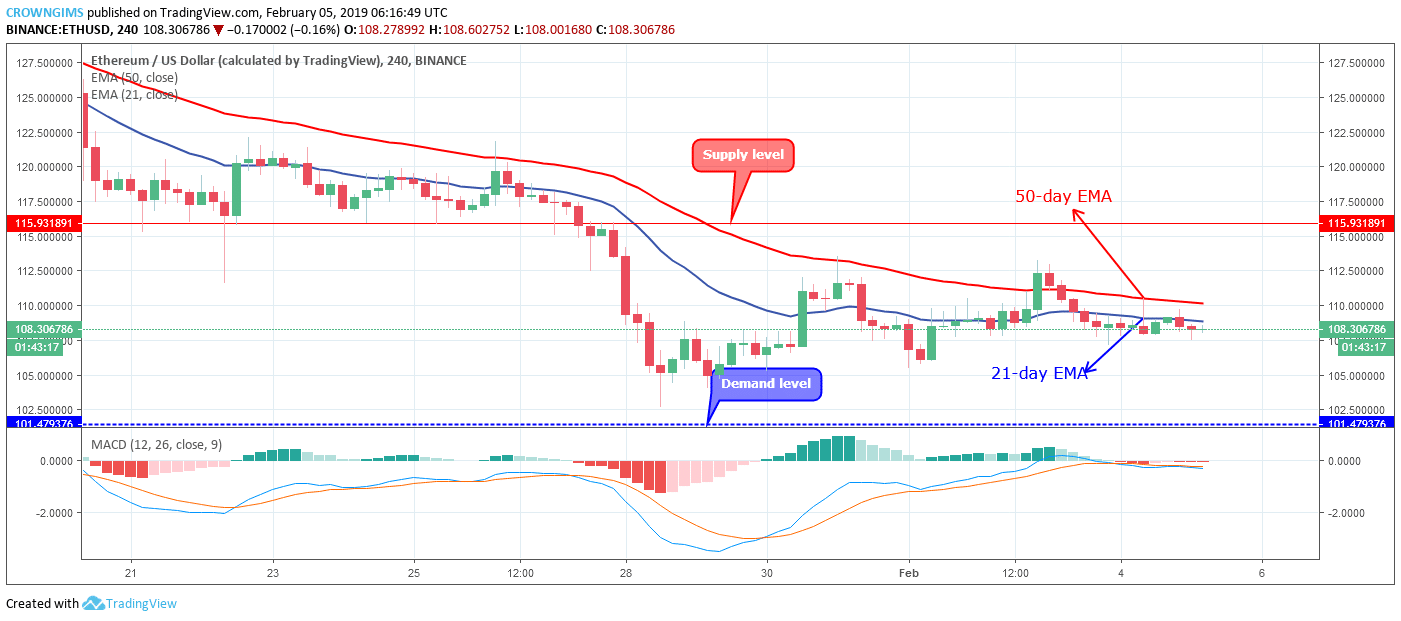 ETH price is ranging on the 4-Hour chart. The Bearish momentum made the ETH/USD found its support at $101 demand level on the 4-hour chart on January 28 with the formation of Doji candle followed by bullish candles that drove Ethereum upward towards the dynamic support and resistance where it started fluctuating in between and around the two EMAs.


