
Author
staff writer
Litecoin is surrounded by darkclouds amid 6.23% year-to-date loss despite the overall market conditions turning severely bullish.
 Edited by Kseniia Klichova
Updated
2 mins read
Edited by Kseniia Klichova
Updated
2 mins read
Litecoin (LTC), initially introduced as an alternative to Bitcoin, has experienced a slowdown in its adoption rate. Previously ranked among the top 10 cryptocurrencies worldwide, it has now fallen to the 20th position, according to CoinMarketCap. Additionally, its token performance since the beginning of the year has been concerning. While the majority of cryptocurrencies have recorded double-digit gains on a year-to-date basis, Litecoin has seen a loss of 6.23%.
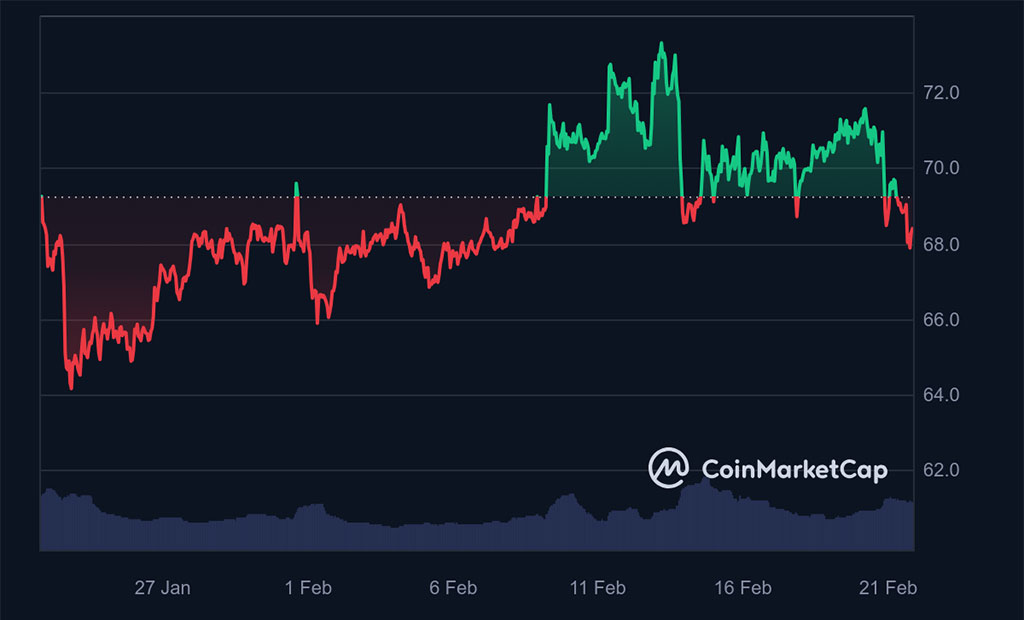
In terms of recent price movements, LTC has decreased by 2.67% on a weekly basis. Despite Bitcoin surpassing the significant $50K psychological threshold, Litecoin has not shown any notable signs of bullish momentum, even though it has historically had a strong correlation with BTC.
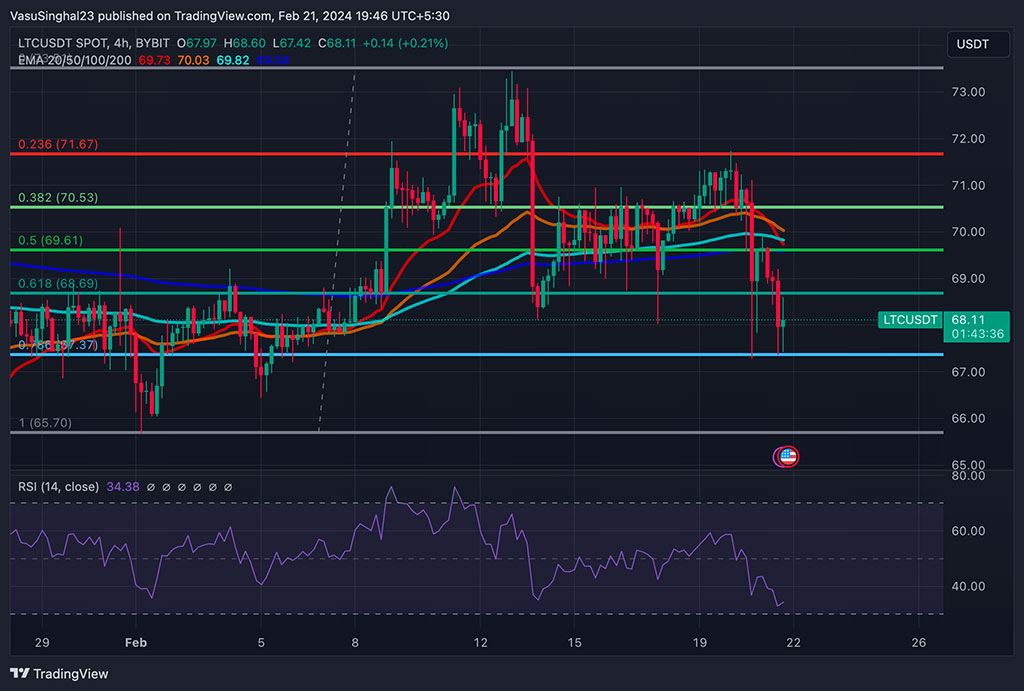
Examining Litecoin’s (LTC) price movements this month reveals that it has fluctuated within a specific range of $65-$75. The chart’s overall appearance suggests that LTC is currently at a crucial juncture, with the 0.786 Fibonacci level acting as a vital support line. A break below this level could lead to increased selling pressure for the cryptocurrency.
This assumption is supported by technical indicators. The EMA-20 has experienced a negative crossover against both the EMA-50 and EMA-100, and appears vulnerable to the EMA-200 as well, potentially placing LTC in a pronounced bearish trend. The Relative Strength Index (RSI) standing at 32.35, has managed to avoid dipping into the oversold territory several times this month. However, a move into the oversold area could lead to further price corrections while simultaneously possibly marking the beginning of a new buying momentum with the anticipation of buying the asset at a relatively lower price.
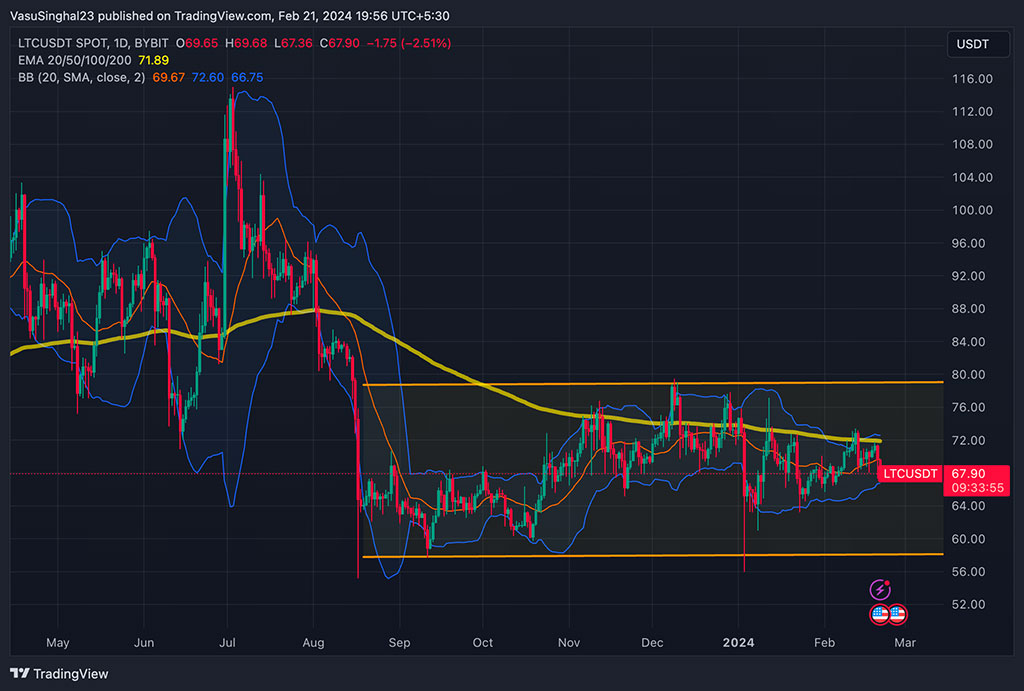
The long-term price chart for Litecoin (LTC) shows that from the latter part of 2023, it has established a solid consolidation range between $60 and $80. Notably, the price has failed to break above this range, indicating that the token has experienced both profit-taking and price averaging from its investors. A concerning indicator is the narrowing of the Bollinger Bands, which last expanded in July 2023, suggesting a declining interest from investors in terms of volume. Additionally, since August 2023, the EMA-200 has consistently been above the price level, indicating that LTC has not aligned with the bullish momentum observed in the overall market conditions.
In summary, for Litecoin (LTC) to enter a new price territory and avoid further declines, it must surpass the $80 price level.
Disclaimer: Coinspeaker is committed to providing unbiased and transparent reporting. This article aims to deliver accurate and timely information but should not be taken as financial or investment advice. Since market conditions can change rapidly, we encourage you to verify information on your own and consult with a professional before making any decisions based on this content.


