Monero (XMR) Price Analysis: Trends of October 3–9, 2018
In case the distribution level of $128 is broken, the pair will resume its uptrend movement and upper distribution territory of $140 will be exposed. A breakout at the upper area or breakdown at the lower area is imminent, so traders should be patient when taking a trade.
By Azeez Mustapha
Updated
2 mins readPhoto: Shutterstock
Key Highlights:
Traders should be patient and wait before taking a trade;
the price may break out of the channel this week;
there is a probability of further ranging movement within the territories.
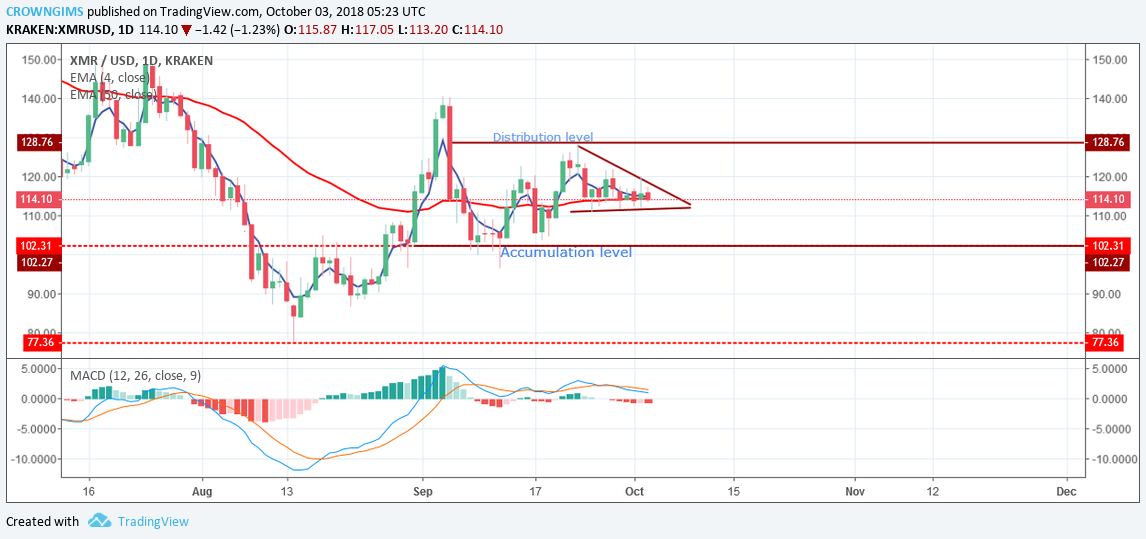
Distribution Territories: $128, $140, $178,
Accumulation Territories: $102, $77, $45The price continues its ranging within the territories of $128 and $102 last week. The strong bearish pressure was lost after a drop in the price of the cryptocurrency to the accumulation territories of $102. The bulls return was confirmed by a bullish hammer candle and the price was up to the distribution territories of $128 before it started consolidating.
Currently, the price is moving towards the accumulation territory of $102 with the formation of bearish candles. The 4-day EMA and the 50-day EMA on the daily chart are closed to each other with the price in between both 4-day EMA and 50-day EMA. The MACD with its histogram is below zero level with the signal lines points downward indicates sell signaling.
In case the distribution level of $128 is broken, the pair will resume its uptrend movement and upper distribution territory of $140 will be exposed. A breakout at the upper area or breakdown at the lower area is imminent therefore traders should be patient and wait before taking a trade.
XMR/USD Price Medium-term Trend: Ranging
The cryptocurrency enters consolidation in its short-term outlook. After a bearish run towards the accumulation territories of $102, rejection to the further downward movement was seen with the formation of a doji and a bullish candle as the bulls made a gradual return.
Price was up towards the distribution territory of $128 earlier last week as the bull sustained the momentum within the range. Price is in between 4-day EMA and the 50-day EMA while 50-day EMA is above the price which indicates that there is a probability for the downward movement this week.
However, the coin may continue ranging within the bound as MACD with its histogram and its signal lines are on the zero level. Patience is the key at this period for a breakout at the upper area or breakdown at the lower area to occur before taking a position.
Azeez Mustapha is a specialist in Computer Studies (including DTP), Forex and Crypto trading professional. Being expert technical and currency analyst, as well as experienced fund manager and author of several books, Azeez places strong focus on crypto market studies conducting comprehensive price analyses and sharing forecasts of presumptive market trends.

 The price continues its ranging within the territories of $128 and $102 last week. The strong bearish pressure was lost after a drop in the price of the cryptocurrency to the accumulation territories of $102. The bulls return was confirmed by a bullish hammer candle and the price was up to the distribution territories of $128 before it started consolidating.
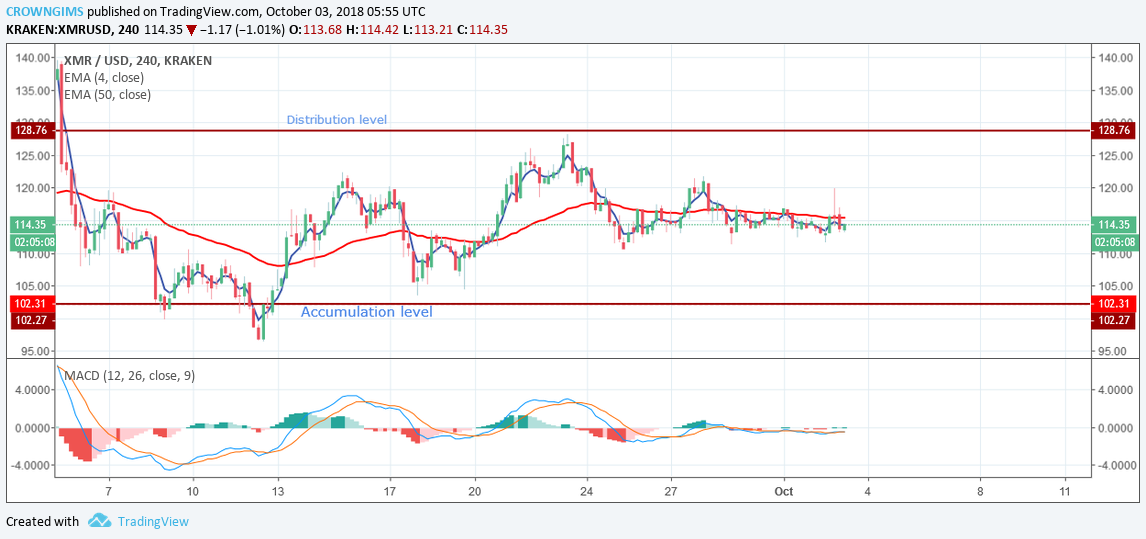 The cryptocurrency enters consolidation in its short-term outlook. After a bearish run towards the accumulation territories of $102, rejection to the further downward movement was seen with the formation of a doji and a bullish candle as the bulls made a gradual return.