According to Glassnode, the breakdown from the $116,000 support zone on July 31 pushed BTC into a low-liquidity “air gap,” with little historical buying activity between $110,000 and $116,000.
Data reveals that opportunistic buyers accumulated around 120,000 BTC during a bounce between $112,000 and $114,000. However, analysts caution that this short-term activity is insufficient to establish durable support.
~120k $BTC were acquired during the rebound from $112k to $114k – evidence of opportunistic buying. Yet supply within the $110k–$116k range remains sparse, meaning stronger accumulation is needed to form lasting support: https://t.co/1J8WjAFubupic.twitter.com/vL4OL3hOlg
Short-term holders, those who bought BTC within the last 155 days, are seeing profits shrink. Their profitability has dropped from 100% to just 70%, a sign that confidence may weaken without strong demand and massive accumulation.
The current short-term holder cost basis lies around $106,000, still below the current market price but inching closer.
On-chain data also shows that large Bitcoin whale wallets booked over $44.5 million in profits over the past 48 hours, signaling a wave of sell-side activity.
Despite this cautious sentiment, experts remain optimistic with the Crypto Fear & Greed Index sitting in the “Greed” zone. Fundstrat’s Tom Lee recently stated that Bitcoin is still the top crypto to buy and projected a $250,000 BTC price target for 2025.
BTC Price at a Crossroads
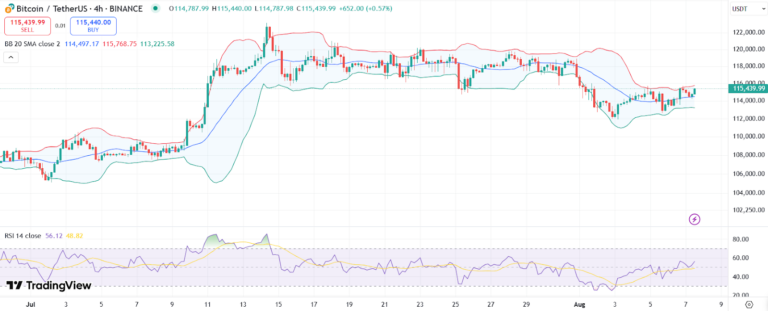
On the 4-hour BTC chart, Bollinger Bands indicate tightening volatility, with price attempting to break above the mid-band (20 SMA) around $115,355.
A sustained move above the upper band near $115,750 could lead the cryptocurrency to the $118,000 resistance level.
BTC price chart with RSI and Bollinger Bands | Source: Trading View
However, rejection at the band could lead to renewed downward pressure, with a weak support around the lower band at $112,000.
The RSI is suggesting a neutral-to-slightly bullish momentum with enough room for upward movement if volume picks up.
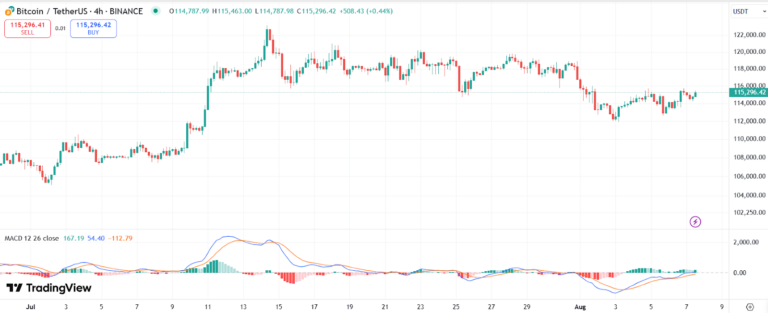
The MACD indicator shows a possible bullish crossover forming, though the signal remains early. If the MACD line breaks above the signal line with increasing green bars, upward momentum could follow. A breakout past $118,200 would signal renewed bullish strength.
Disclaimer: Coinspeaker is committed to providing unbiased and transparent reporting. This article aims to deliver accurate and timely information but should not be taken as financial or investment advice. Since market conditions can change rapidly, we encourage you to verify information on your own and consult with a professional before making any decisions based on this content.
A crypto journalist with over 5 years of experience in the industry, Parth has worked with major media outlets in the crypto and finance world, gathering experience and expertise in the space after surviving bear and bull markets over the years. Parth is also an author of 4 self-published books.