Solana ETFs Beat Bitcoin, Ethereum Funds in Daily Net Flow
Solana ETFs attracted $14.9 million in net inflows on November 4, led by Bitwise’s BSOL, while Bitcoin and Ethereum ETFs experienced significant outflows totaling $785.8 million combined.
Bitwise's BSOL dominated Solana ETF inflows with $13.2 million while Bitcoin ETFs lost $566.4 million in the same trading session.
SOL price dropped to $146 before recovering above the critical $155 support level despite experiencing double-digit percentage losses.
Total net flows for Solana ETFs remain modest at $284 million compared to Bitcoin's $60.4 billion and Ethereum's $14 billion accumulated inflows.
Bitwise recently launched its spot Solana ETF, BSOL, which is attracting significant demand, surpassing spot Bitcoin and Ethereum ETFs in daily net flow on November 4. This came on another day when red candles dominated the charts for most cryptocurrencies in centralized and decentralized exchanges, including SOL.
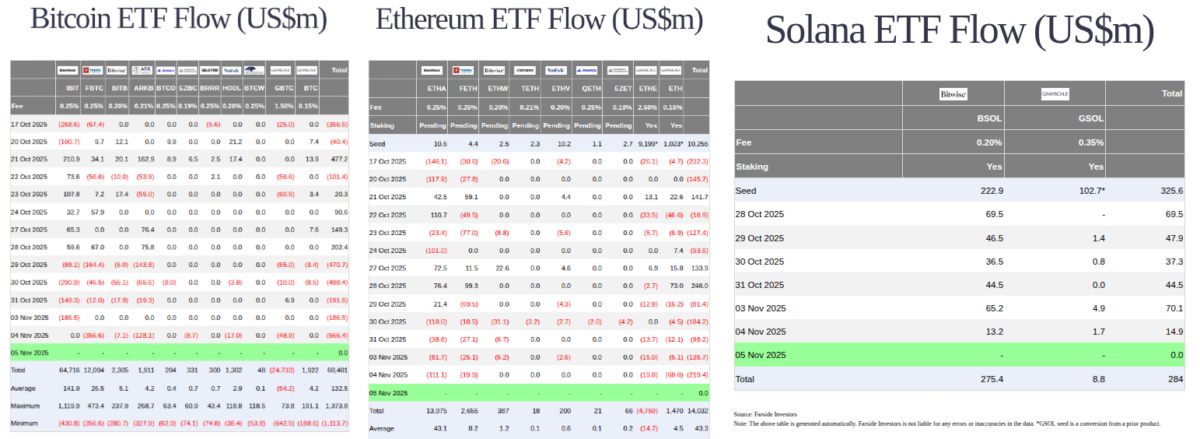
Data is from Farside on November 5, looking at the previous day’s settlements for the exchange-traded funds in traditional markets. According to the data, Solana ETFs had a $14.9 million inflow, dominated by Bitwise’s BSOL, with $13.2 million, while Grayscale’s GSOL had a $1.7 million inflow.
On the other hand, Bitcoin and Ethereum ETFs had outflows totaling $566.4 million and $219.4 million on the same day, respectively. BlackRock’s IBIT and ETHA saw the highest outflows of $356.6 million and $111.1 million, respectively.
Bitcoin, Ethereum, and Solana ETF flows (US$m), as of November 5, 2025 | Source: Farside
Nevertheless, Solana ETFs still have a long way to go to match the total net flow of the other two products, which already top $60.4 billion for BTC and $14 billion for ETH—while the recently launched SOL funds sum up to $284 million as of Farside data.
Solana (SOL) Price Analysis and Market Movements
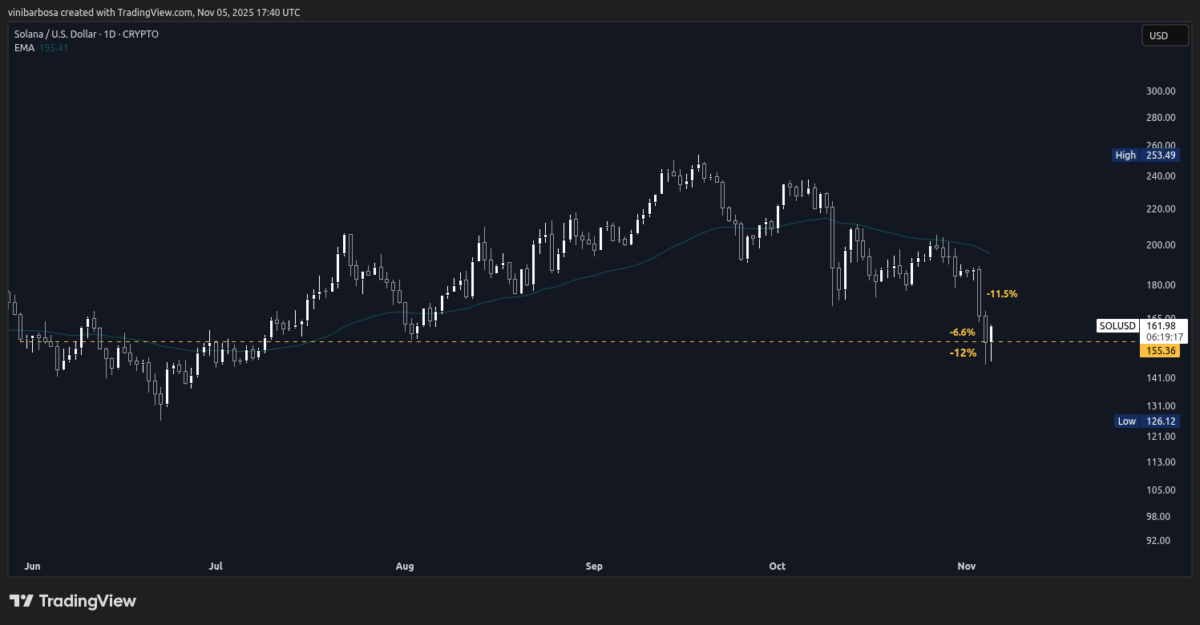
As of this writing, SOL is trading at $162 per token, recovering from the recent dips that struck its price below an important level since January 2025—now a support zone at $155 that previously acted as resistance.
On Monday, November 3, SolanaSOL$87.3624h volatility:3.2%Market cap:$49.97 BVol. 24h:$2.40 B
saw daily losses of 11.5% from open to close, per TradingView’s CRYPTO index. On November 4, the day of the reported ETF data, SOL registered as low as 12% losses from opening to the lowest price, at $146 per token, closing the day above the $155 support. From opening to closing, Solana has 6.6% losses on that day despite the inflows from BSOL and GSOL in Wall Street.
Today, November 5, SOL has already revisited the local bottom, bouncing immediately after that above the support level.
Solana (SOL) daily (1D) price chart, as of November 5, 2025 | Source: TradingView
An earlier report by Coinspeaker noted fatigue signs in Solana as the token tested the aforementioned lows. Yet, the “onchain Nasdaq,” as some advocates call the chain, shows that it could recover from here—fueled by an increasing demand from institutional and retail investors using TradFi vehicles like the ETFs.
Disclaimer: Coinspeaker is committed to providing unbiased and transparent reporting. This article aims to deliver accurate and timely information but should not be taken as financial or investment advice. Since market conditions can change rapidly, we encourage you to verify information on your own and consult with a professional before making any decisions based on this content.
Vini Barbosa has covered the crypto industry professionally since 2020, summing up to over 10,000 hours of research, writing, and editing related content for media outlets and key industry players. Vini is an active commentator and a heavy user of the technology, truly believing in its revolutionary potential. Topics of interest include blockchain, open-source software, decentralized finance, and real-world utility.