Stellar Price Analysis: XLM/USD Trends of February 14–20, 2019
The bears have to gain enough pressure in order to break down the demand level of $0.07 that will expose Stellar price to the low level of $0.06. Increase in the bulls’ pressure will break up the $0.09 supply level and the coin may target $0.12 price level.
By Azeez Mustapha
Updated
2 mins readPhoto: QuoteInspector
Key Highlights:
The breakdown of $0.07 level will expose $0.06 Stellar price level;
the breakup of $0.09 mark will make XLM price rise to $0.12;
consolidation in progress in the XLM market;
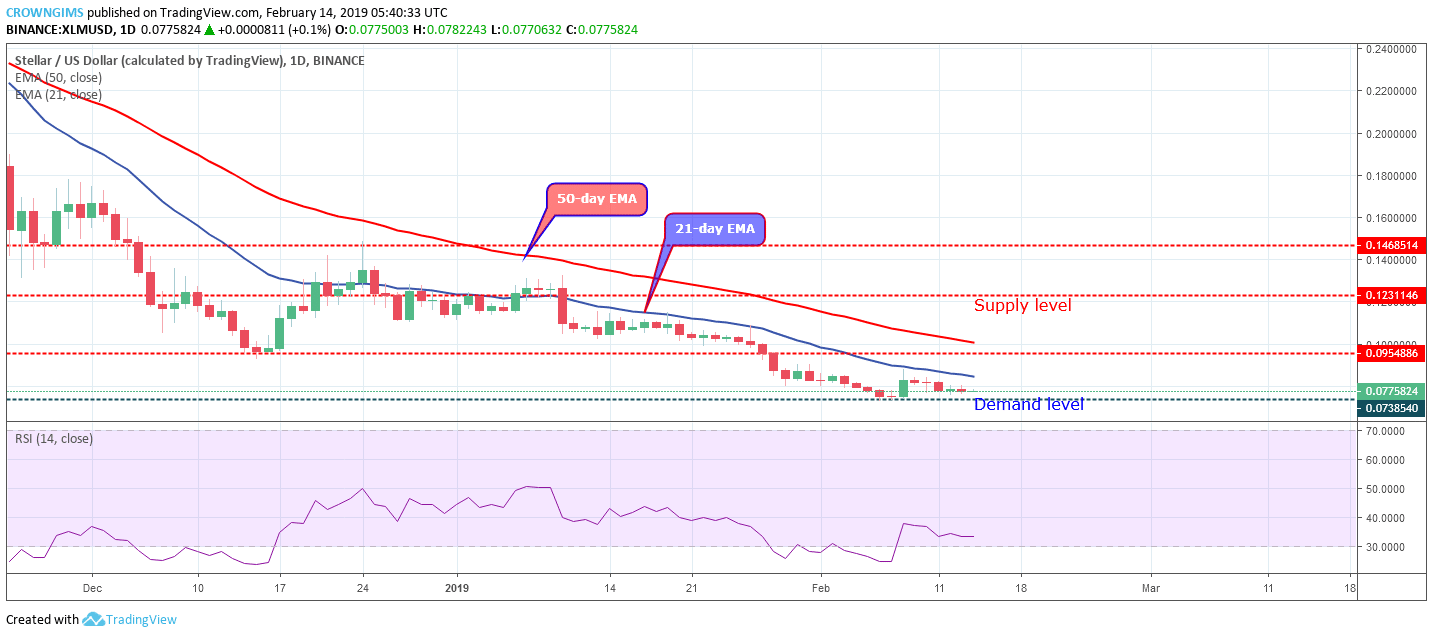
XLM/USD Price Long-term Trend: Bearish
Supply levels: $0.09, $0.12, $0.14
Demand levels: $0.07, $0.06, $0.05On the long-term outlook, XLM/USD is still in bearish trend. Though the coin remains on bearish trend, the Bears’ momentum was very weak to the extent that it could not breakdown the demand level of $0.07 where it was last week. On February 8, the bulls tried to push Stellar price up but the momentum was not enough to break up the dynamic resistance of 21-day EMA, the XLM returned to upper week low level of $0.07.
Stellar price still maintains its position trading below the 21-day EMA and 50-day EMA, with the two EMAs, fanned apart which implies a bearish trend in the XLM market. Since three days ago, the XLM price has been consolidating at the demand level of $0.07 with the formation of daily doji candles. The Relative Strength Index period 14, is placed flat horizontally without showing any direction connotes that consolidation is ongoing.
The bears have to gain enough pressure in order to break down the demand level of $0.07 that will expose Stellar price to the low level of $0.06. Increase in the bulls’ pressure will break up the $0.09 supply level and the coin may target $0.12 price level.
XLM/USD Price Medium-term Trend: Ranging
XLM/USD is ranging on the 4-Hour chart. XLM price was on its bearish trend last week; the bears dominate the XLM market for more than four weeks now. The bulls interrupted the bearish trend at $0.07 demand level on the 4-Hour chart.
The bullish momentum was triggered as the bullish engulfing candle formed on February 8 which propelled the coin towards the supply level of $0.09 but unable to reach the target because of bears’ pressure interruption and the XLM price resulted to sideways movement.
Stellar price is trading on and around the 21-day EMA and 50-day EMA which indicates that consolidation is ongoing and may continue for a short period of time.
Azeez Mustapha is a specialist in Computer Studies (including DTP), Forex and Crypto trading professional. Being expert technical and currency analyst, as well as experienced fund manager and author of several books, Azeez places strong focus on crypto market studies conducting comprehensive price analyses and sharing forecasts of presumptive market trends.

 On the long-term outlook, XLM/USD is still in bearish trend. Though the coin remains on bearish trend, the Bears’ momentum was very weak to the extent that it could not breakdown the demand level of $0.07 where it was last week. On February 8, the bulls tried to push Stellar price up but the momentum was not enough to break up the dynamic resistance of 21-day EMA, the XLM returned to upper week low level of $0.07.
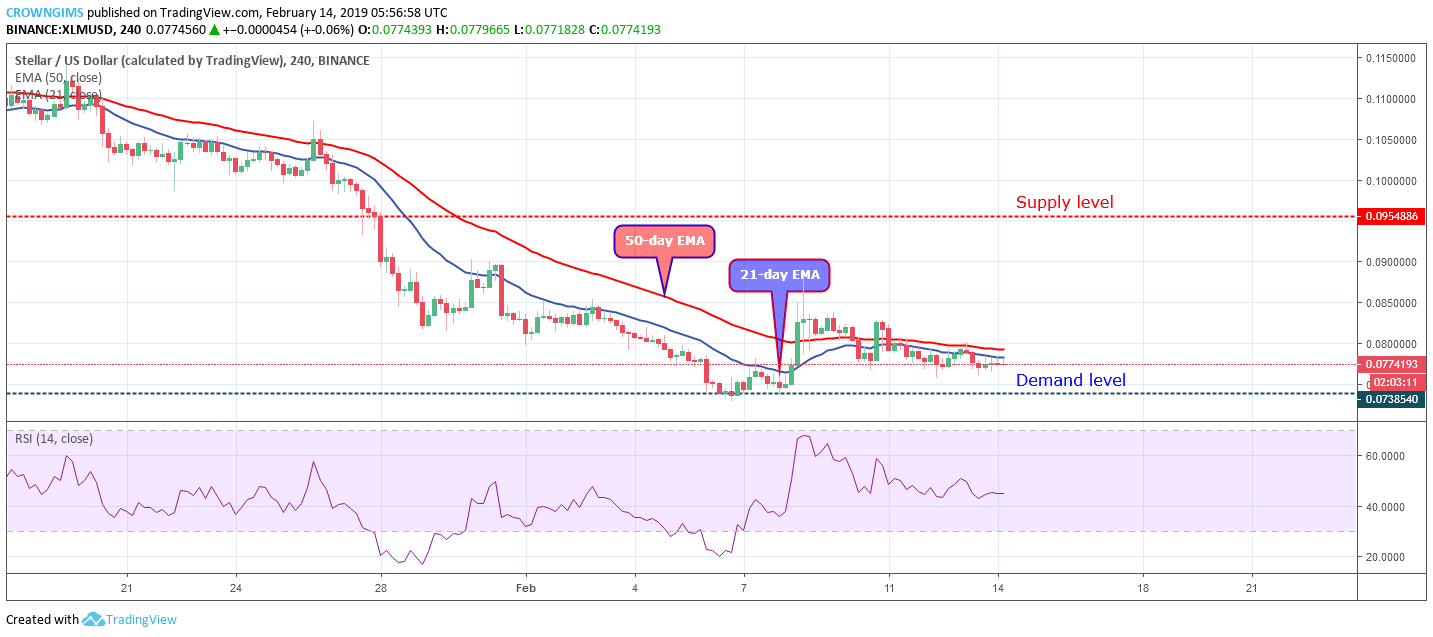 XLM/USD is ranging on the 4-Hour chart. XLM price was on its bearish trend last week; the bears dominate the XLM market for more than four weeks now. The bulls interrupted the bearish trend at $0.07 demand level on the 4-Hour chart.