Stellar (XLM) Price Analysis: Trends of August 30–September 5, 2018
The price is still in a valid bearish phase as long as it stays within the resistance level of $0.24 and the support level of $0.19. In the near future, we may expect price break out from the channel that will lead to increases in the rates.
By Azeez Mustapha
Updated
2 mins readPhoto: Shutterstock
Key Highlights:
Consolidation pattern continues;
the price may break out towards North anytime;
there is a need for the trader to wait for the breakout.
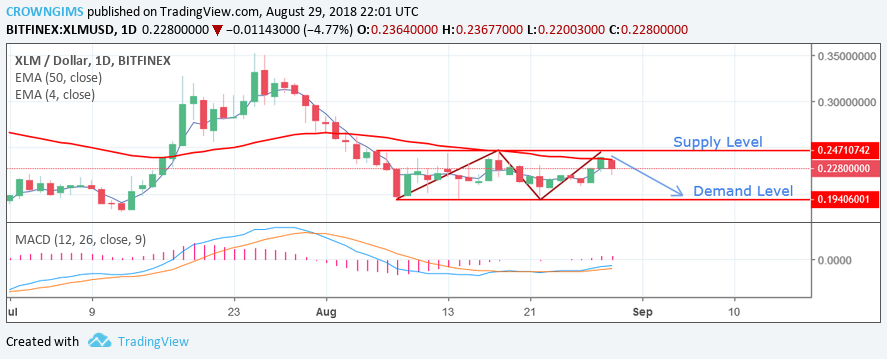
XLM/USD Long-term Trend: Bearish
Resistance levels: $0.24, $0.30, $0.36
Support levels: $0.19, $0.17, $0.15XLM/USD attempted to push higher last week topped at the resistance level of $0.24 but closed lower. The price is still in a valid bearish phase as long as it stays within the resistance level of $0.24 and the support level of $0.19. Stella has been consolidating within the channel for more than three weeks.
MACD indicator is at the zero level with its signal lines twisted to each other on the daily chart, which indicates that the consolidation of the price within a range may continue this week. This does not rule out a possibility of an increase in price towards the resistance level at 0.24.
The cryptocurrency made some faint bullish effort that was often followed by consolidation in the market. A clear break and weekly close above the resistance level of $0.30 would expose the price to the strong resistance level of $0.36. In the near future, we may expect price break out from the channel that will lead to increases in the rates.
XLM/USD Price Medium-term Trend: Bearish
The Stella bounced from the resistance level of $0.24 and the bears pushed it to the support level of $0.19, after which strong bullish candles were formed on the medium term, which means that bulls want to take control. That does not mean that the price cannot move below the support level of $0.24. As at present, the price is directed towards the south, the price has to go below the support level of $0.19 for the continuation of a bearish movement and this will expose it to another support level of $0.17. There is a need for the trader to wait for the breakout.
Azeez Mustapha is a specialist in Computer Studies (including DTP), Forex and Crypto trading professional. Being expert technical and currency analyst, as well as experienced fund manager and author of several books, Azeez places strong focus on crypto market studies conducting comprehensive price analyses and sharing forecasts of presumptive market trends.

 XLM/USD attempted to push higher last week topped at the resistance level of $0.24 but closed lower. The price is still in a valid bearish phase as long as it stays within the resistance level of $0.24 and the support level of $0.19. Stella has been consolidating within the channel for more than three weeks.
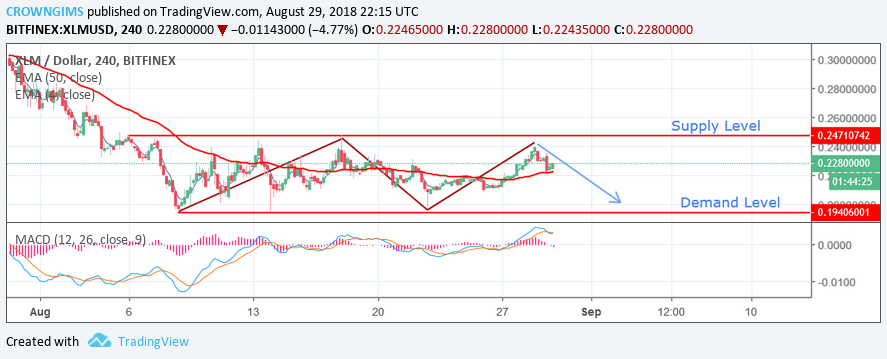 The Stella bounced from the resistance level of $0.24 and the bears pushed it to the support level of $0.19, after which strong bullish candles were formed on the medium term, which means that bulls want to take control. That does not mean that the price cannot move below the support level of $0.24. As at present, the price is directed towards the south, the price has to go below the support level of $0.19 for the continuation of a bearish movement and this will expose it to another support level of $0.17. There is a need for the trader to wait for the breakout.