While the broader crypto market rally takes a pause, market analysts are hopeful that the Ripple cryptocurrency will still continue with further upside. Three technical chart setups show that a rally to $6 is imminent from here.
XRP Price Rally to $6 Soon?
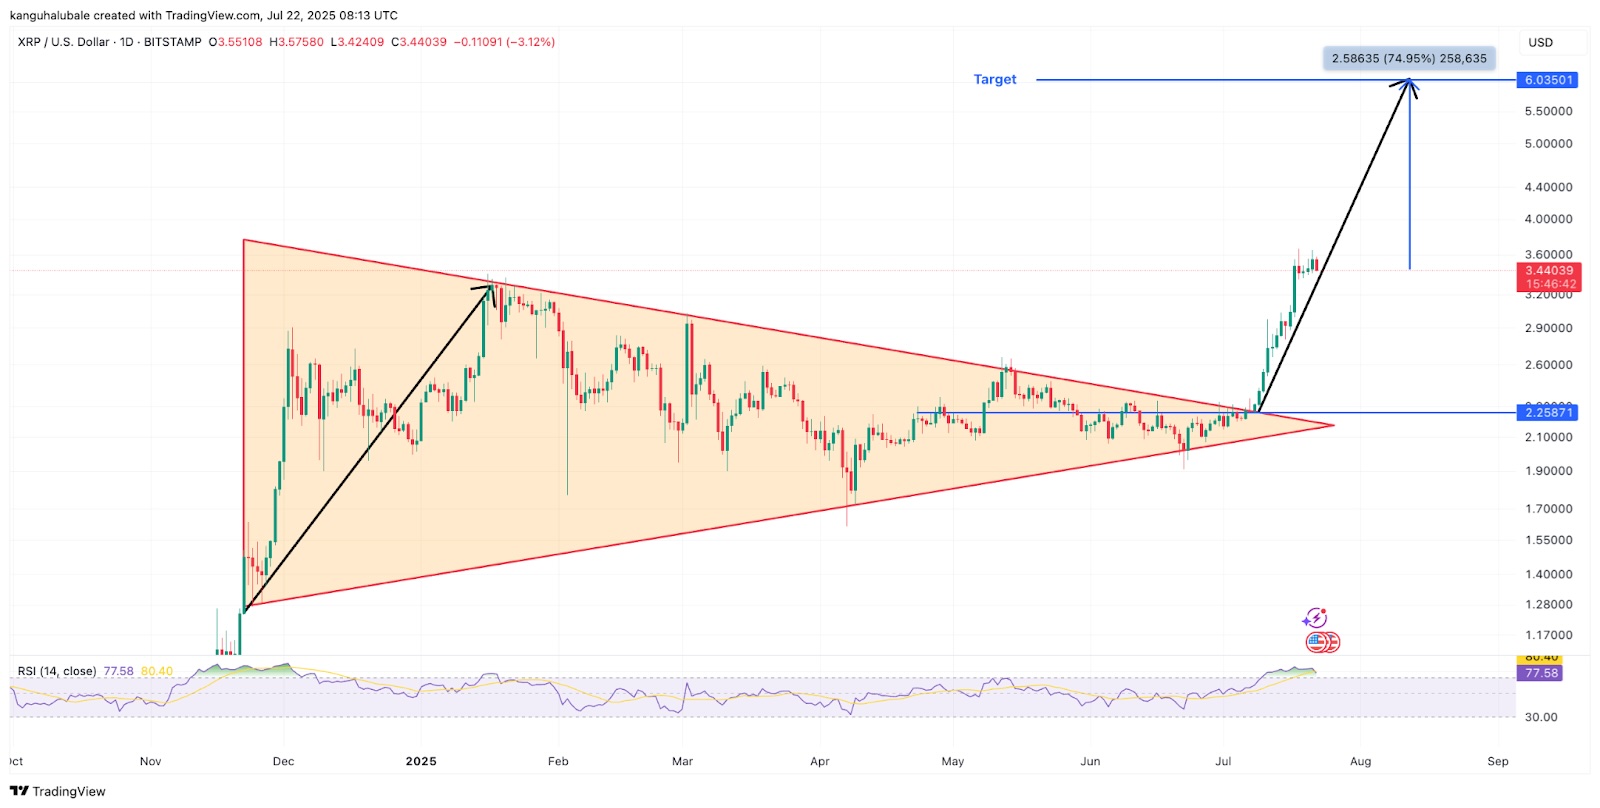
The XRP price chart shows the formation of a symmetrical triangle pattern on the daily. Once the Ripple cryptocurrency gives a daily close above the eight-year highs of $3.66, it could continue on its upward trajectory with a desired target of $6.03.
According to a post by the trader Binance Killers on X, XRP has broken out of its symmetrical triangle and is now retesting the breakout zone, signaling continued bullish momentum.
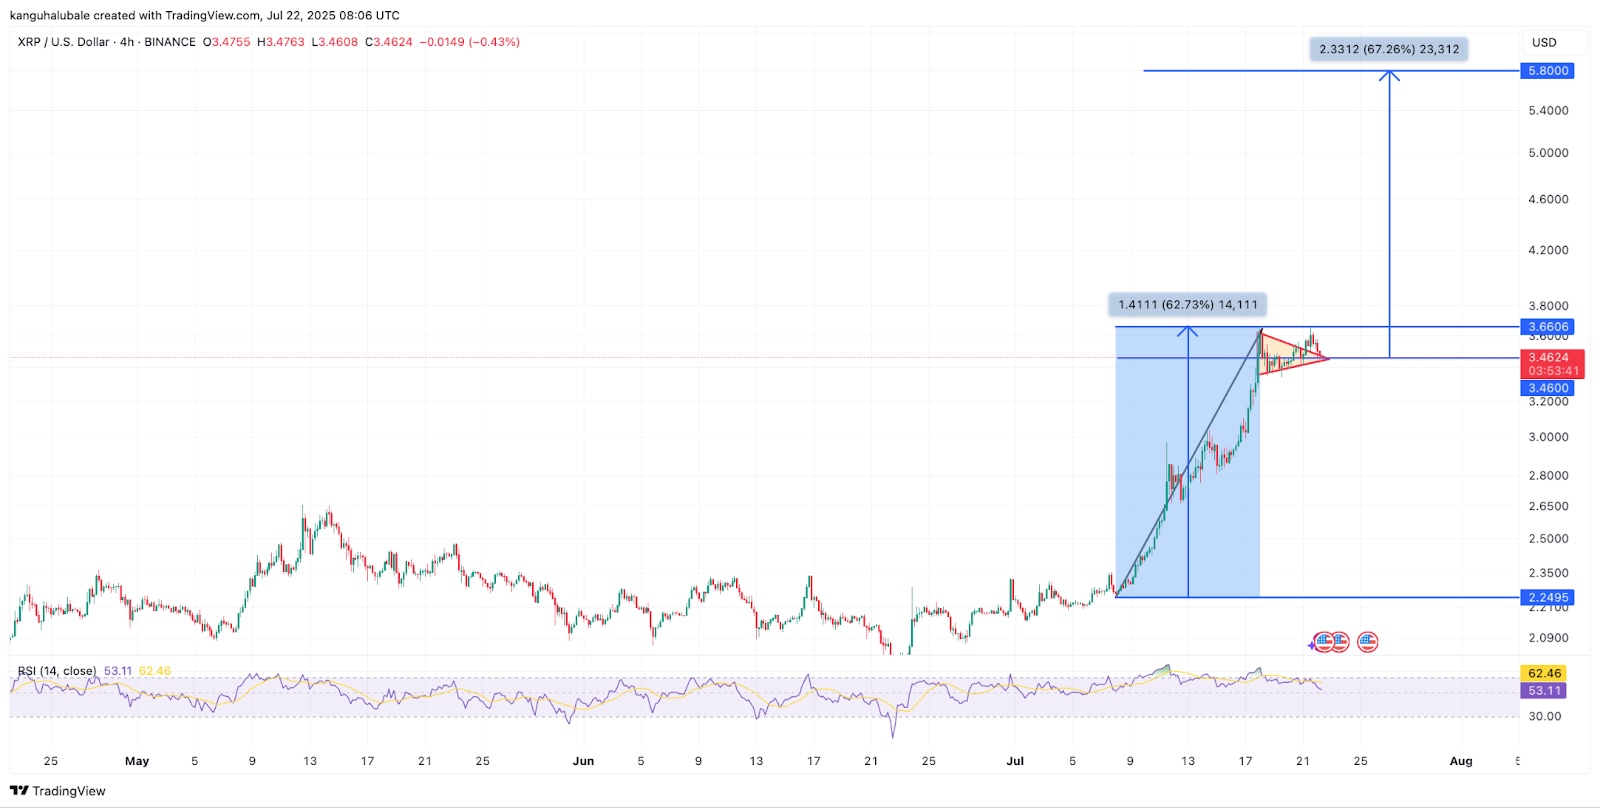
The four-hour chart for XRP reveals the formation of a bull pennant pattern, with the price currently testing resistance at the upper trendline near $3.46.
A decisive candlestick close above this level could trigger a breakout toward the pattern’s projected target of $5.80, a potential 67% gain from current levels.
A bull pennant is a classic bullish continuation pattern, usually forming as a brief consolidation phase following a sharp upward move, and often resulting in a breakout that resumes the prior uptrend.
XRP price rally and breakout – Source: TradingView
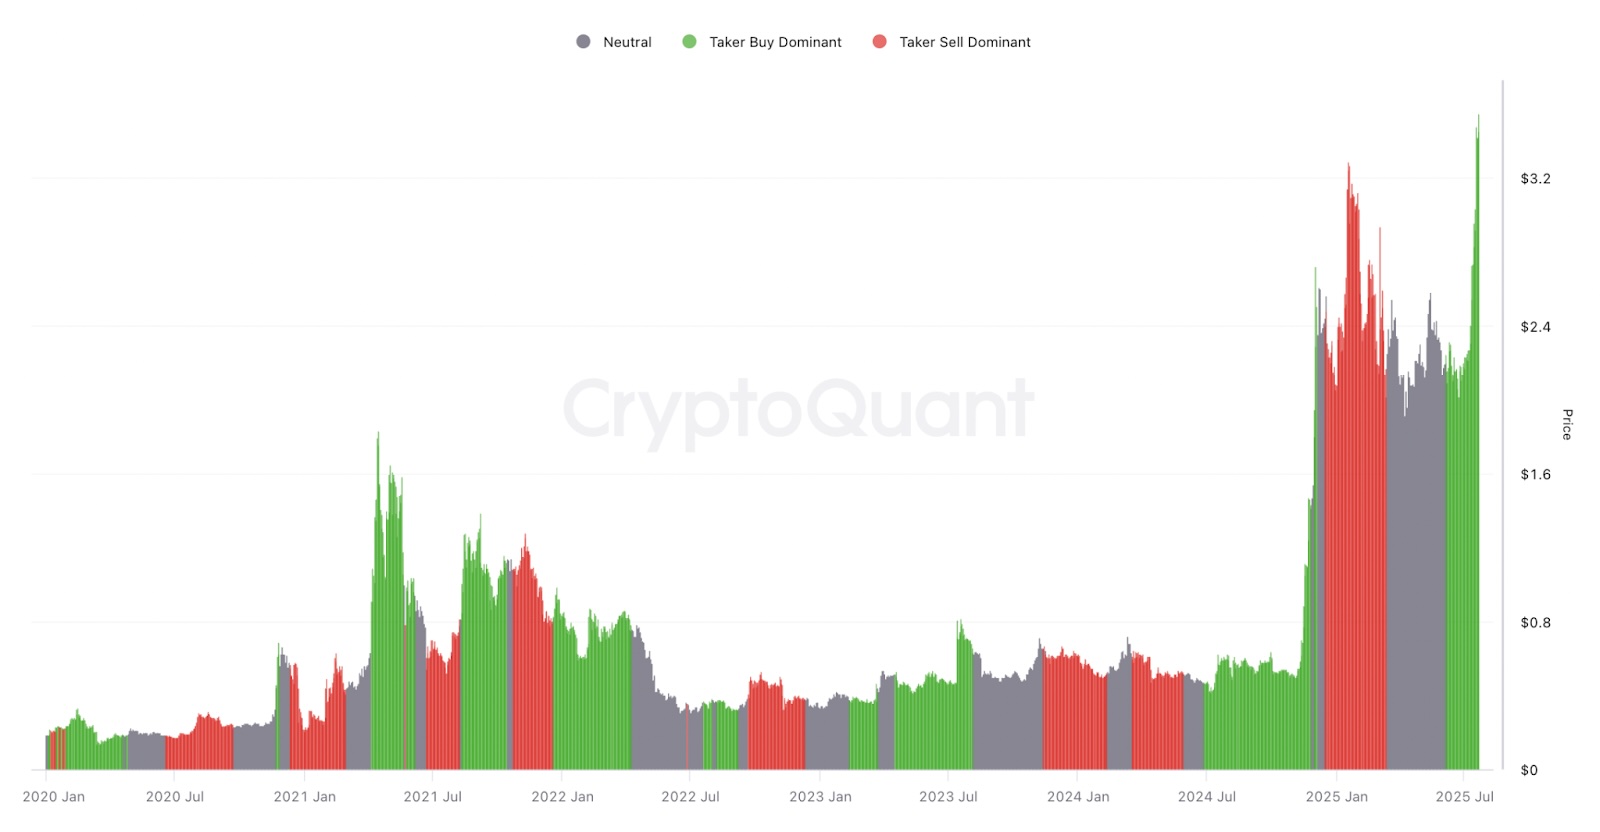
On-chain data also shows strength for the XRP price. The 90-day spot taker cumulative volume delta (CVD) indicates renewed dominance of buy-side orders.
Since early June, demand-side pressure has consistently outweighed selling, driving the XRP/USD pair to multi-year highs above $3.66.
Positive CVD highlights optimism among bullish traders, stating that the rally can continue further.
The chart shows that buy orders are still outnumbering sell orders, despite nearly 99% of XRP holders already being in profit at current prices.
Disclaimer: Coinspeaker is committed to providing unbiased and transparent reporting. This article aims to deliver accurate and timely information but should not be taken as financial or investment advice. Since market conditions can change rapidly, we encourage you to verify information on your own and consult with a professional before making any decisions based on this content.
Bhushan is a FinTech enthusiast and holds a good flair in understanding financial markets. His interest in economics and finance draw his attention towards the new emerging Blockchain Technology and Cryptocurrency markets. He is continuously in a learning process and keeps himself motivated by sharing his acquired knowledge. In free time he reads thriller fictions novels and sometimes explore his culinary skills.