US GDP data for Q2 2025 was recorded on Tron, boosting TRX investor confidence.
Analyst sees bullish sweep with targets up to $0.4229.
Tron’s native token TRX TRX$0.2824h volatility:0.9%Market cap:$26.57 BVol. 24h:$446.59 M
is holding ground around $0.339 amid major volatility in the broader crypto market. Popular analyst Crypto Patel noted on X that TRX has formed a bullish setup after sweeping downside liquidity.
The analyst stated that a confirmed break above $0.3520 could take the token upwards, targeting $0.3700, $0.4053, and even $0.4229 in the near term. Patel believes that Tron’s liquidity structure hints at strong accumulation before the next wave of buying pressure.
$TRX Long Setup: Bullish Sweep Signals Push Toward $0.42#TRX swept downside liquidity and is showing signs of bullish displacement. A confirmed CISD break at $0.3520 sets the stage for an upside move.
This surge in bullish sentiment comes soon after the US Department of Commerce announced Tron as one of nine blockchains chosen to record the release of the country’s Q2 2025 Gross Domestic Product (GDP) data.
Tron has been officially selected by the U.S. Department of Commerce as one of nine blockchains to record the release of the United States’ Q2 2025 Gross Domestic Product (GDP) data. https://t.co/7d3VIBzROk
— H.E. Justin Sun 👨🚀 (Astronaut Version) (@justinsuntron) September 1, 2025
Observers say this recognition by the US government strengthens Tron’s credibility as an enterprise-ready blockchain capable of hosting critical data. Notably, Tron’s founder Justin Sun is the only Chinese entrepreneur represented among the selected networks.
Following the announcement, TRX saw a surge in market activity with many calling it the best crypto to buy right now. According to CoinMarketCap, the cryptocurrency’s 24-hour trading volume jumped 40% to reach $687 million.
TRX Price Outlook
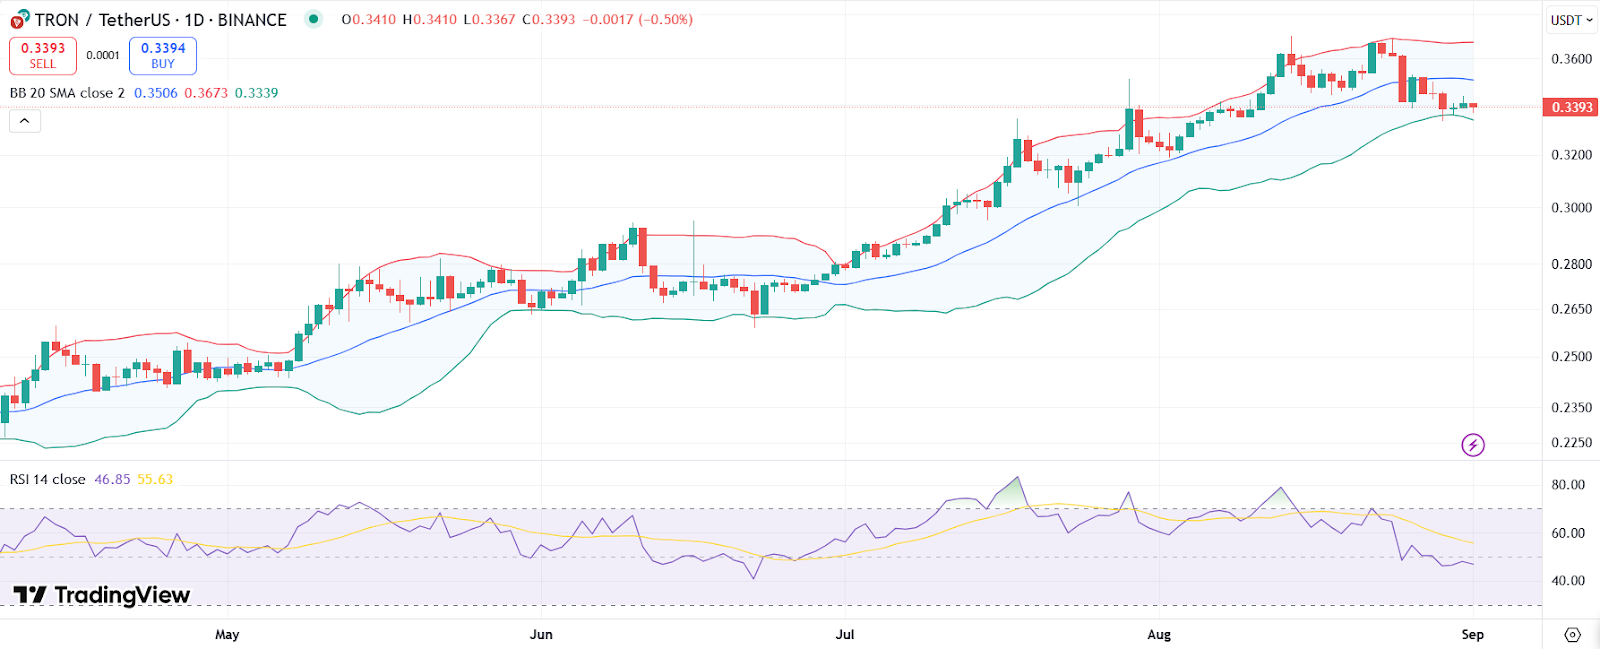
While TRX recorded little movement in the past day, its long-term performance remains impressive, with a 110% increase over the past year. The ninth largest crypto token saw its local peak of $0.367 on Aug. 24 amid major whale accumulation.
On the daily chart, TRX price is currently trading around the middle Bollinger Band (20-day SMA) near $0.339. This indicates consolidation with the lower band offering support around $0.333 and resistance building near $0.367.
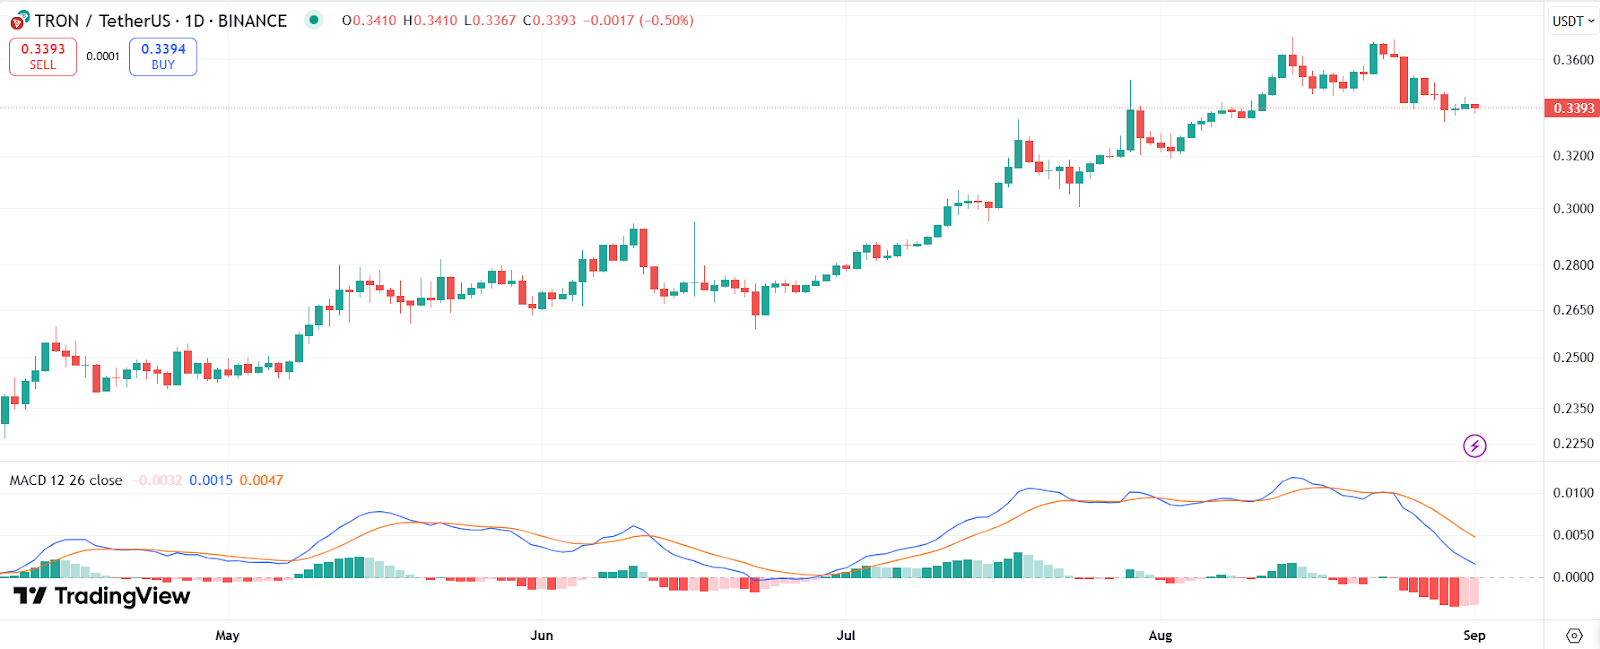
TRX price chart with MACD | Source: TradingView
The RSI is currently suggesting neutral-to-weak momentum after cooling from overbought territory in August. A daily close above $0.3520 could lead TRX to $0.3700, with further targets at $0.4053 and $0.4229.
TRX price chart with MACD | Source: TradingView
Meanwhile, the MACD shows bearish momentum, with the signal line crossing above the MACD line and red histogram bars widening, hinting at short-term downside pressure. If TRX slips below $0.333 support, traders could see a price drop to $0.320 and $0.300.
Disclaimer: Coinspeaker is committed to providing unbiased and transparent reporting. This article aims to deliver accurate and timely information but should not be taken as financial or investment advice. Since market conditions can change rapidly, we encourage you to verify information on your own and consult with a professional before making any decisions based on this content.
A crypto journalist with over 5 years of experience in the industry, Parth has worked with major media outlets in the crypto and finance world, gathering experience and expertise in the space after surviving bear and bull markets over the years. Parth is also an author of 4 self-published books.