The correction came amid a 38% gain earlier in the week, where Pi rose from $0.47 to $0.66 on speculation tied to artificial intelligence integration and growing community hype around the upcoming Pi2Day event.
Mixed Narrative for Pi Network
Traders who bought the dip below $0.55 were quick to capitalize on the early-week rally, but a looming token unlock scheduled for July, potentially injecting 274 million PI into circulation, cast a shadow on the near-term outlook.
Currently, approximately 680 million #Picoins are in circulation by pioneers.
About 3.8 billion Pi coins have been migrated, but 2.6 billion of these are still locked up from the first migration and have not yet been released.
Still, optimism around Pi2Day, set for June 28, is keeping hopes of a sustained uptrend alive. Rumors around an AI partnership, possibly with Google AI, were sparked by co-founder Nicolas Kokkalis’s appearance on a generative AI panel at Consensus 2025.
This was further fueled by cryptic Pi Network posts hinting at big announcements, driving an increase in social media chatter and interest in Pi’s long-term value proposition.
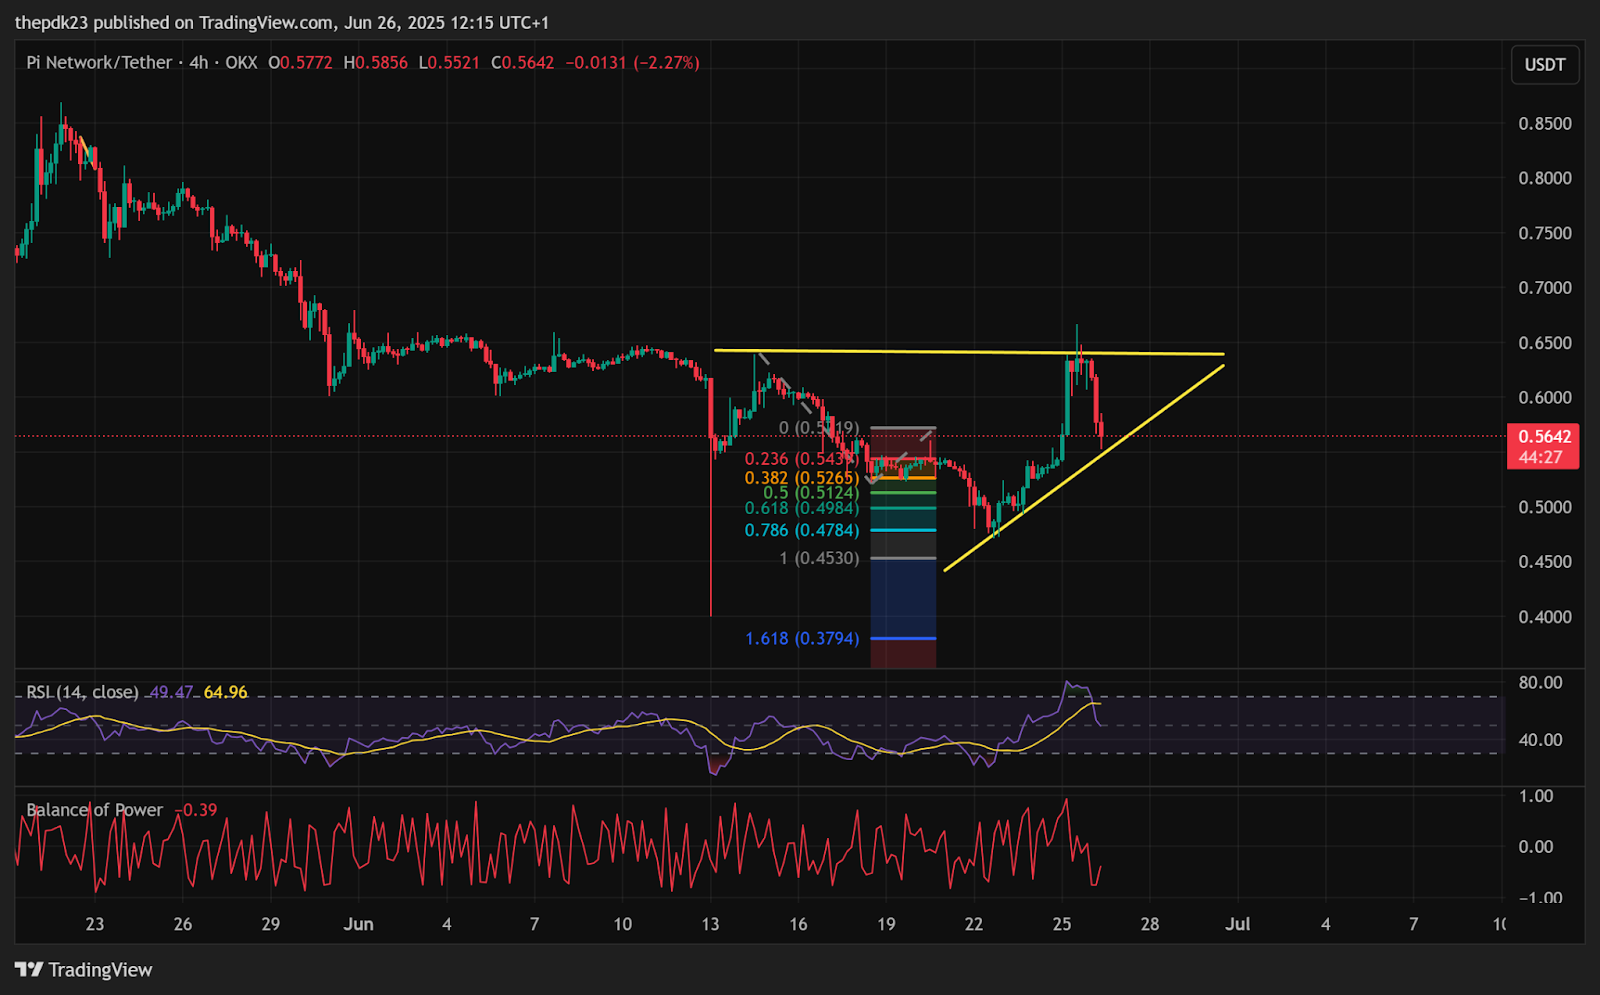
The PI 4-hour chart shows a clear ascending triangle pattern forming, with the lower trendline building consistent higher lows, and horizontal resistance near $0.66 being tested repeatedly. This pattern often indicates bullish continuation.
The RSI, although cooling off from overbought territory, remains in healthy mid-range levels around 50, indicating that Pi’s uptrend is consolidating rather than collapsing.
The Balance of Power (BoP) also shows early signs of bullish accumulation after dipping briefly into negative territory.
PI forms an ascending triangle | Source: TradingView
From a Fibonacci perspective, the recent rally retraced sharply but respected the 0.382 level around $0.5265, often a strong support zone in bullish retracements.
Holding above this level, and ideally reclaiming the 0.236 fib near $0.5434, would signal strength. The Pi Coin Price Prediction shows breakout targets as high as $3.
Should PI break out of the triangle structure with conviction, the immediate price target would lie around $0.75, with a further move toward the golden ratio extension at $0.84, aligning with the 1.618 Fibonacci extension of the previous swing move.
Disclaimer: Coinspeaker is committed to providing unbiased and transparent reporting. This article aims to deliver accurate and timely information but should not be taken as financial or investment advice. Since market conditions can change rapidly, we encourage you to verify information on your own and consult with a professional before making any decisions based on this content.
A crypto journalist with over 5 years of experience in the industry, Parth has worked with major media outlets in the crypto and finance world, gathering experience and expertise in the space after surviving bear and bull markets over the years. Parth is also an author of 4 self-published books.