UNI trading volume spiked 54% to $856 million amid renewed investor interest.
The token is steadily approaching the key resistance zone of $7.5.
UNI has broken out of a months-long falling wedge, with analysts targeting $10–$11.
Uniswap UNI$6.5624h volatility:8.5%Market cap:$3.94 BVol. 24h:$697.41 M
is showing signs of renewed bullish momentum after gaining 4% in the past 24 hours, currently trading near $7.13. Its 24-hour trading volume has also jumped by 54%, reaching around $856 million.
This uptick follows a recent announcement by the team that nearly half of all Uniswap activity now occurs on Ethereum Layer-2 networks. The market responded positively, with UNI up 12% over the last seven days.
Long-term uni price outlook
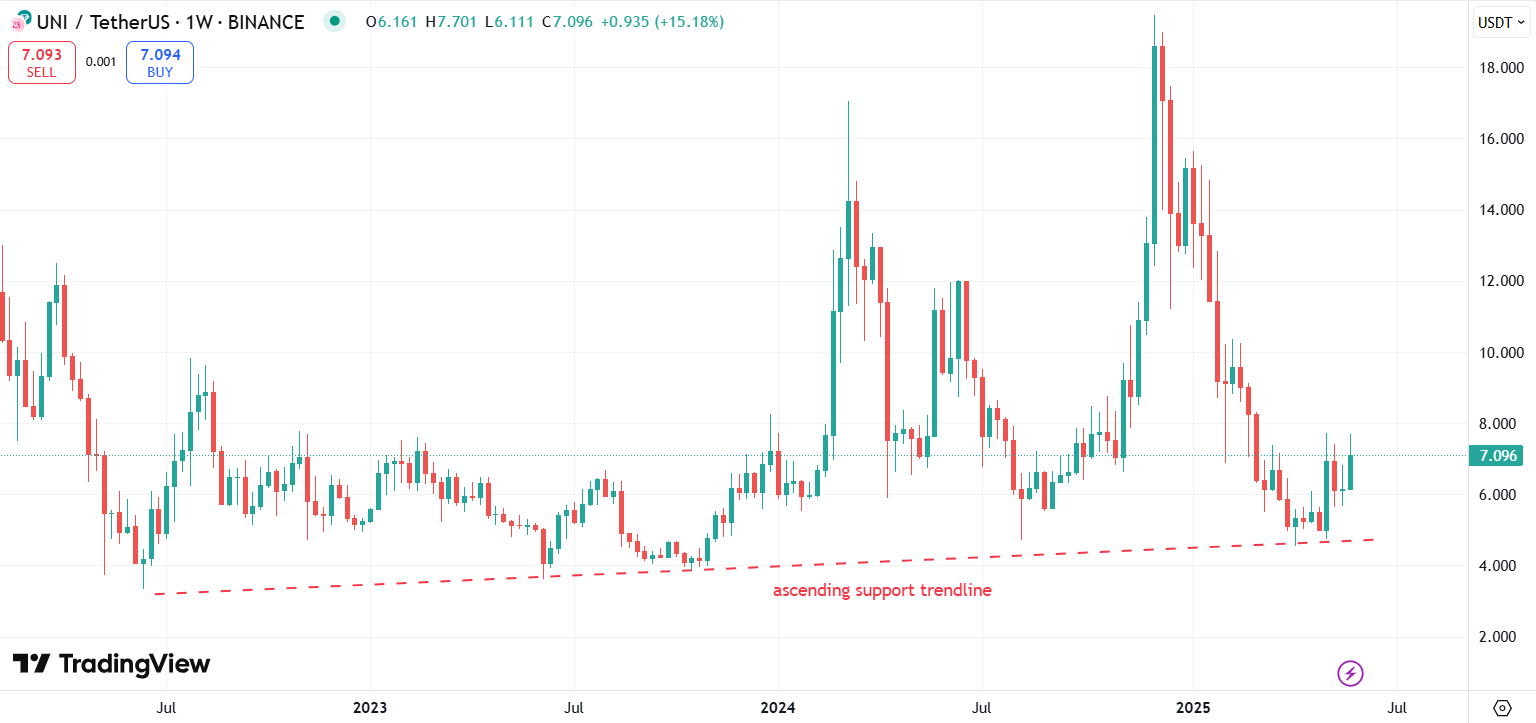
On the weekly timeframe, UNI has been gradually climbing along an ascending support trendline that’s remained intact since July 2022. This trendline has withstood several retests, including two recent ones in April and May, both followed by rebounds.
UNI weekly chart with ascending support trendline | Source: Trading View
The May retest even formed a bullish engulfing candlestick, a classic reversal pattern. Despite these promising signals, UNI remains well below its key Fibonacci resistance level at $10.35. This suggests that the recent price action appears more like a recovery than a full-fledged breakout.
Breakout from falling wedge sparks optimism
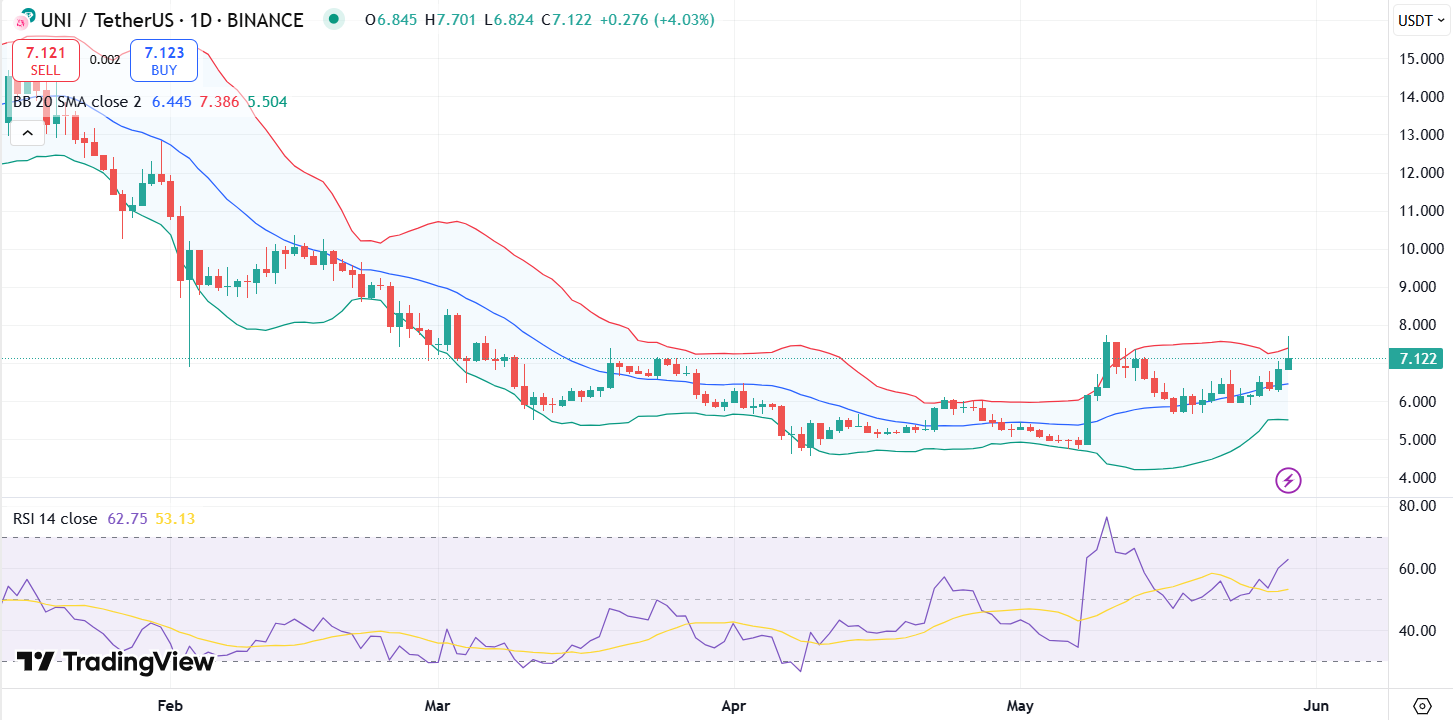
On the daily UNI price chart, the RSI currently sits around 62, suggesting bullish momentum but also hinting at potential exhaustion if buying pressure doesn’t continue. If the price fails to hold above the support of $6.70, traders might see a short-term correction.
UNI daily chart with RSI and Bollinger Bands | Source: TradingView
The Bollinger Bands have widened, with the price having broken above the middle band (the 20-day simple moving average), a sign of upward momentum. Currently, UNI is trading close to the upper Bollinger Band, suggesting the token may face immediate resistance near $7.50.
A confirmed breakout above this could send the cryptocurrency to the next psychological level at $8.00, with $10.35 as a mid-term target if momentum continues.
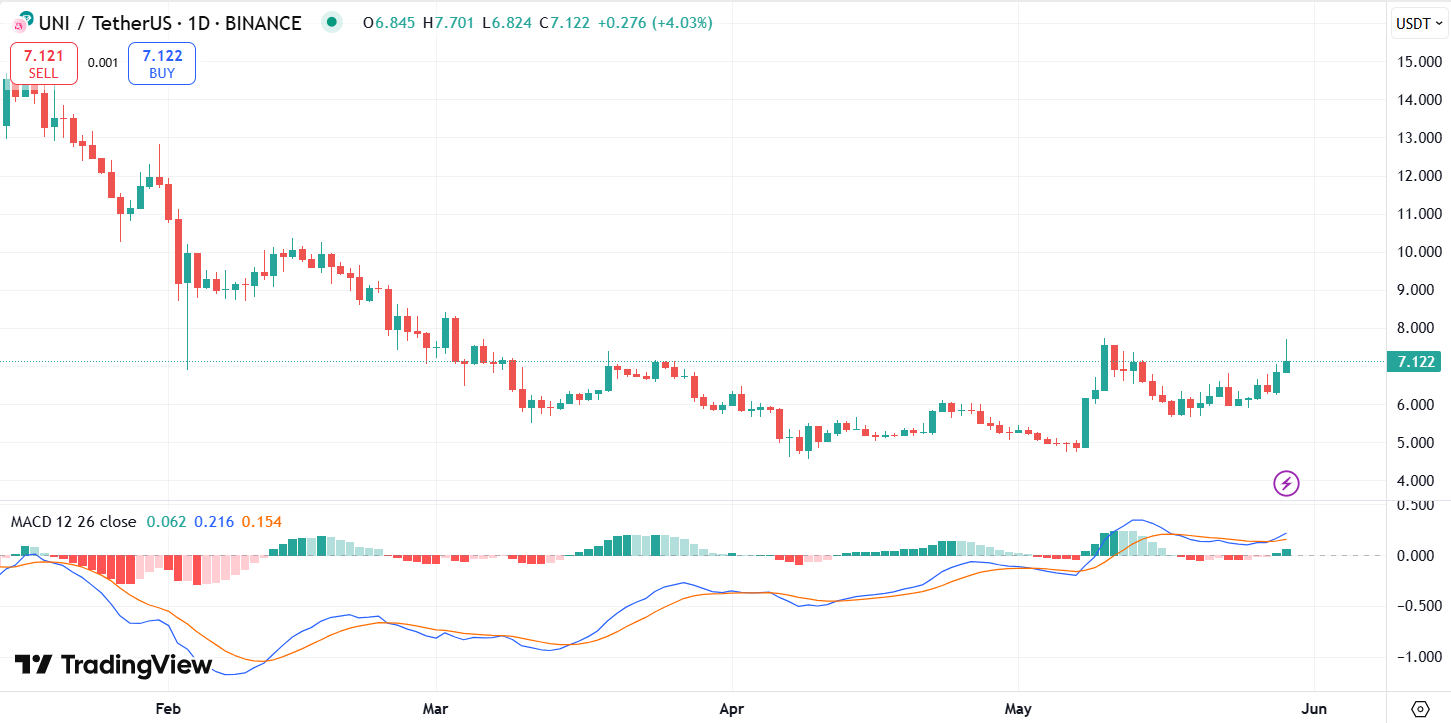
Meanwhile, the MACD line has just crossed above the signal line. Histogram bars are also growing in the green zone, indicating positive momentum and increasing buying pressure. This crossover typically indicates the start of a new uptrend.
UNI daily chart with MACD | Source: TradingView
Meanwhile, crypto analyst Solberg Invest noted on X that UNI recently broke out of a falling wedge pattern on the daily chart. The pattern, in formation since mid-November 2024, is known for trend reversals.
Disclaimer: Coinspeaker is committed to providing unbiased and transparent reporting. This article aims to deliver accurate and timely information but should not be taken as financial or investment advice. Since market conditions can change rapidly, we encourage you to verify information on your own and consult with a professional before making any decisions based on this content.
A crypto journalist with over 5 years of experience in the industry, Parth has worked with major media outlets in the crypto and finance world, gathering experience and expertise in the space after surviving bear and bull markets over the years. Parth is also an author of 4 self-published books.