Bitcoin Price Analysis: BTC/USD Trends of November 19–25, 2018
In case the bears were able to break down side the accumulation territory of $5,419 the Bitcoin price will have its low at $5,336. If the accumulation territory of $5,419 holds the bulls may take over the market.
By Azeez Mustapha
Updated
2 mins readPhoto: QuoteInspector
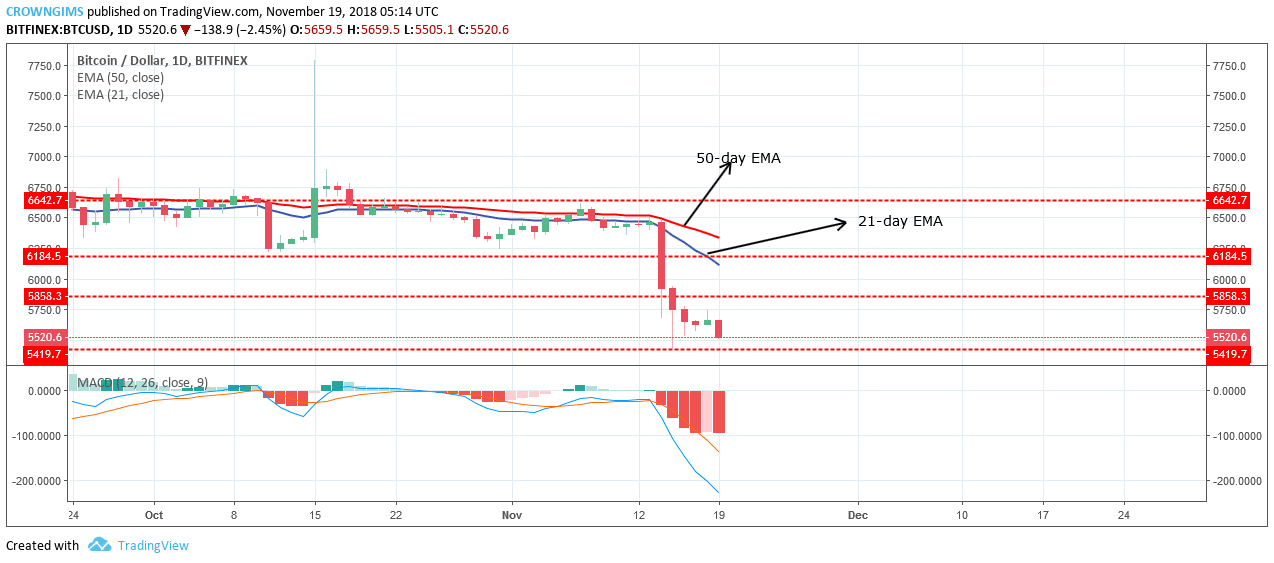
Distribution Territories: $5,858, $6,184, $6,642
Accumulation Territories: $5,419, $5,346, $5,220
BTC is still bearish on the long-term outlook. Bitcoin price experienced a sharp drop a few days ago. The bears took the whole control of the market after broken out from the consolidation phase. Last week distribution territories were broken downside such as; $6,184, $5,858. BTC price is currently exposed to the accumulation territory of $5,419.
A bearish move can’t currently be ruled out as more bearish Japanese candles are still emerging; an indication that BTC price may still experience southward movement. 21-day EMA is under 50-day EMA fanned apart and the Bitcoin price is below the two EMAs which implies that the bearish movement is ongoing with high bears’ pressure.
The MACD with its histogram is below zero levels with the signal lines well separated and pointing to the south which indicates that the bears are still in control of the BTC market and the BTC price may still sell further.
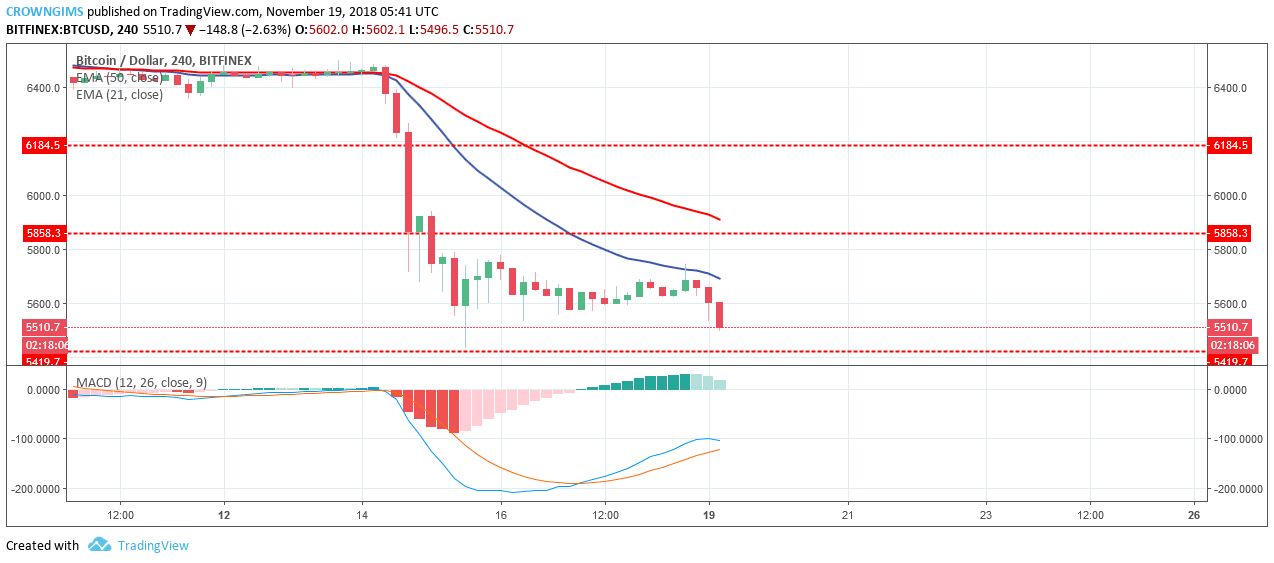
BTCUSD Medium-term Trend: Ranging
On the 4-Hour chart, BTC/USD is ranging. The bears have been in control of the BTC market for more than three days. The sharp fall of BTC price was acclaimed to the bears’ pressure which pushed the BTC price below the distribution territories of $5,858 on November 15 and the price commenced consolidation within the range of $5,858 and the accumulation territories of $5,419 on 4-Hour chart.
Currently, the Bitcoin price is below the 21-day EMA and 50-day EMA which implies a decrease in the BTC price is ongoing. However, the MACD with its histogram is above zero level fading gradually toward zero level. In case the bears were able to break downside the accumulation territory of $5,419 the BTC price will have its low at $5,336. If the accumulation territory of $5,419 holds the bulls may take over the market.
Azeez Mustapha is a specialist in Computer Studies (including DTP), Forex and Crypto trading professional. Being expert technical and currency analyst, as well as experienced fund manager and author of several books, Azeez places strong focus on crypto market studies conducting comprehensive price analyses and sharing forecasts of presumptive market trends.

 On the 4-Hour chart, BTC/USD is ranging. The bears have been in control of the BTC market for more than three days. The


