Bitcoin Price Analysis: BTC/USD Expected to Break Down $7,812 Price Level
Radical fundamental force may be required to break up the strong resistance level of $8,233. The resistance level may be broken up should the Bulls push up Bitcoin price and touch the level of $8,233 fourth time.
strong bullish momentum is required to break up the $8,233 level;
the Bears may break down the $7,812 level.
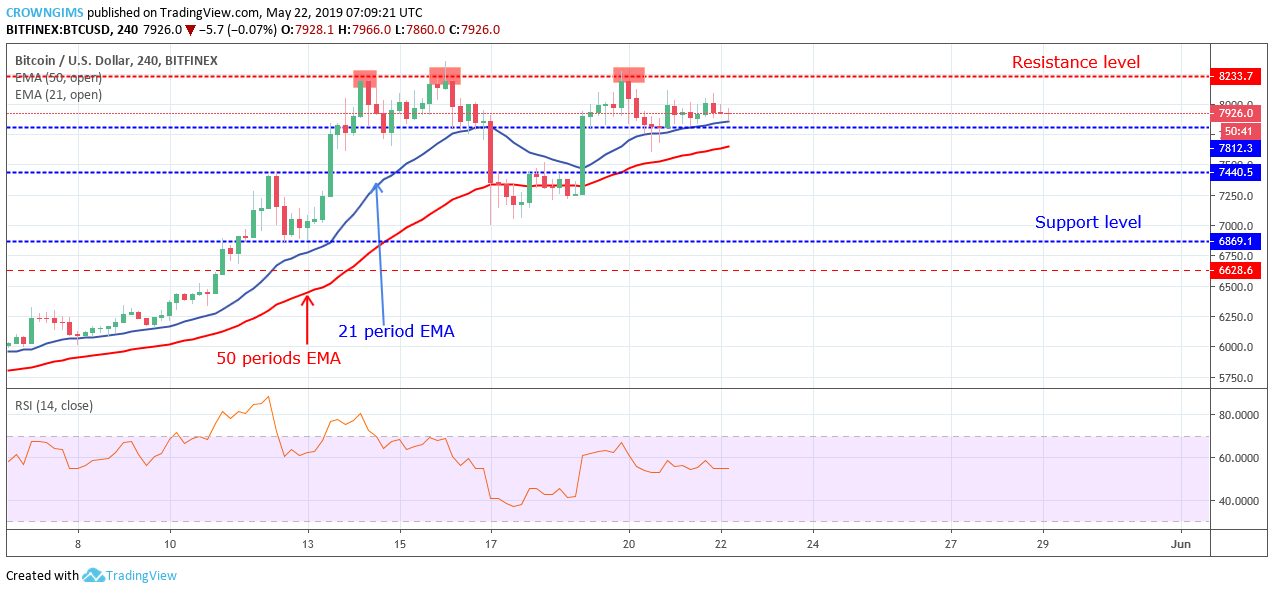
BTC/USD Medium-term Trend: Ranging
Resistance levels: $8,233, $8,678, $9,265
Support levels: $7,812 $7,440, $6,869BTC/USD is moving sideways on the medium-term outlook. The crypto has touched the resistance level of $8,233 three times and bounced back; the Bulls pushed Bitcoin price to touch the mentioned resistance level on May 14, pulled back and touched the same level on May 16, the Bears defended the resistance level and the price dropped to $7,440. The Bulls pushed up BTC price again and topped at the same former resistance level ($8,233). The price dropped to $7,812 demand level. The momentum of both the Bears and the bulls became weak; the price is currently consolidating at $7,812 level.
Radical fundamental force may be required to break up the strong resistance level of $8,233. The resistance level may be broken up should the Bulls push up Bitcoin price and touch the level of $8,233 fourth time.
In case the Bulls have no momentum to drive the coin and the demand level of $7,812 does not hold, bearish pressure may expose the $7,440 level. However, the Relative Strength index period 14 is flat horizontally at the level above 50; this confirms the ongoing consolidation movement in the BTC market.
BTC/USD Short-term Trend: Ranging
BTC/USD is ranging in the short-term outlook. On May 19, the BTC price reached the resistance level of $8,233. The Evening star candle pattern formed; this is a bearish reversal candle pattern and the price descended to the demand level of $7,812 level. The driving force of both the Bulls and the Bears became weak at the level. This led to the sideways movement experiencing currently in the BTC market.
Nevertheless, the Relative Strength Index period 14 is at 50 levels with the signal line bending to the south which indicates a sell signal.
Azeez Mustapha is a specialist in Computer Studies (including DTP), Forex and Crypto trading professional. Being expert technical and currency analyst, as well as experienced fund manager and author of several books, Azeez places strong focus on crypto market studies conducting comprehensive price analyses and sharing forecasts of presumptive market trends.

 BTC/USD is moving sideways on the medium-term outlook. The crypto has touched the resistance level of $8,233 three times and bounced back; the Bulls pushed Bitcoin price to touch the mentioned resistance level on May 14, pulled back and touched the same level on May 16, the Bears defended the resistance level and the price dropped to $7,440. The Bulls pushed up BTC price again and topped at the same former resistance level ($8,233). The price dropped to $7,812 demand level. The momentum of both the Bears and the bulls became weak; the price is currently consolidating at $7,812 level.
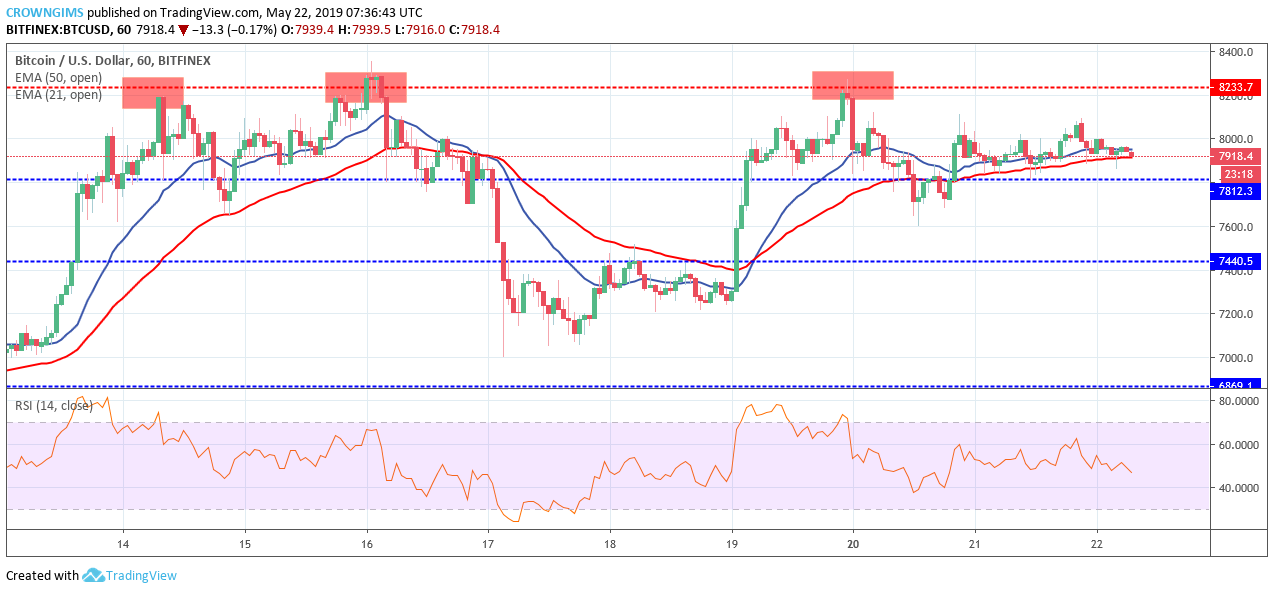 BTC/USD is ranging in the short-term outlook. On May 19, the BTC price reached the resistance level of $8,233. The Evening star candle pattern formed; this is a bearish reversal candle pattern and the price descended to the demand level of $7,812 level. The driving force of both the Bulls and the Bears became weak at the level. This led to the sideways movement experiencing currently in the BTC market.


