However, new analysis suggests that Bitcoin’s price is no longer primarily tied to halvings. Instead, broader adoption trends, market structure, and institutional activity appear to be the real drivers of long-term cycles.
Beyond the Halving Narrative
On-chain analyst James Check said that Bitcoin has experienced three major cycles so far, none of which align neatly with halving events.
He identified the first as the “adoption cycle” from 2011 to 2018, dominated by retail participants. The second, the “adolescence cycle” from 2018 to 2022, was defined by speculative leverage and volatile boom-and-bust phases.
In my opinion, Bitcoin has experienced three cycles, and they are not anchored around the halvings.
They are anchored around the trends in adoption and market structure, with the 2017 top, and 2022 bottom being the transition points 🔴 Retail early adoption 🟠 Wild West, Boom &… pic.twitter.com/3rbUUpnwen
The current phase, beginning after the 2022 bear market, is the “maturity cycle,” which reflects greater institutional involvement and a more stable market structure.
Check pointed out that the real inflection points were the 2017 peak and the 2022 bottom. Both moments marked shifts in adoption and maturity rather than direct links to halving events.
Investors who continue to anchor expectations to the halving schedule may be missing the bigger picture.
Evidence From MVRV and Exchange Flows
The MVRV Short-Term Holder (STH) chart shows that in earlier phases, MVRV spikes often coincided with overheated tops, while deep drops signaled major bottoms.
In the current cycle, however, volatility has dampened. The reduced fluctuation shows the increasing influence of longer-term investors and institutions.
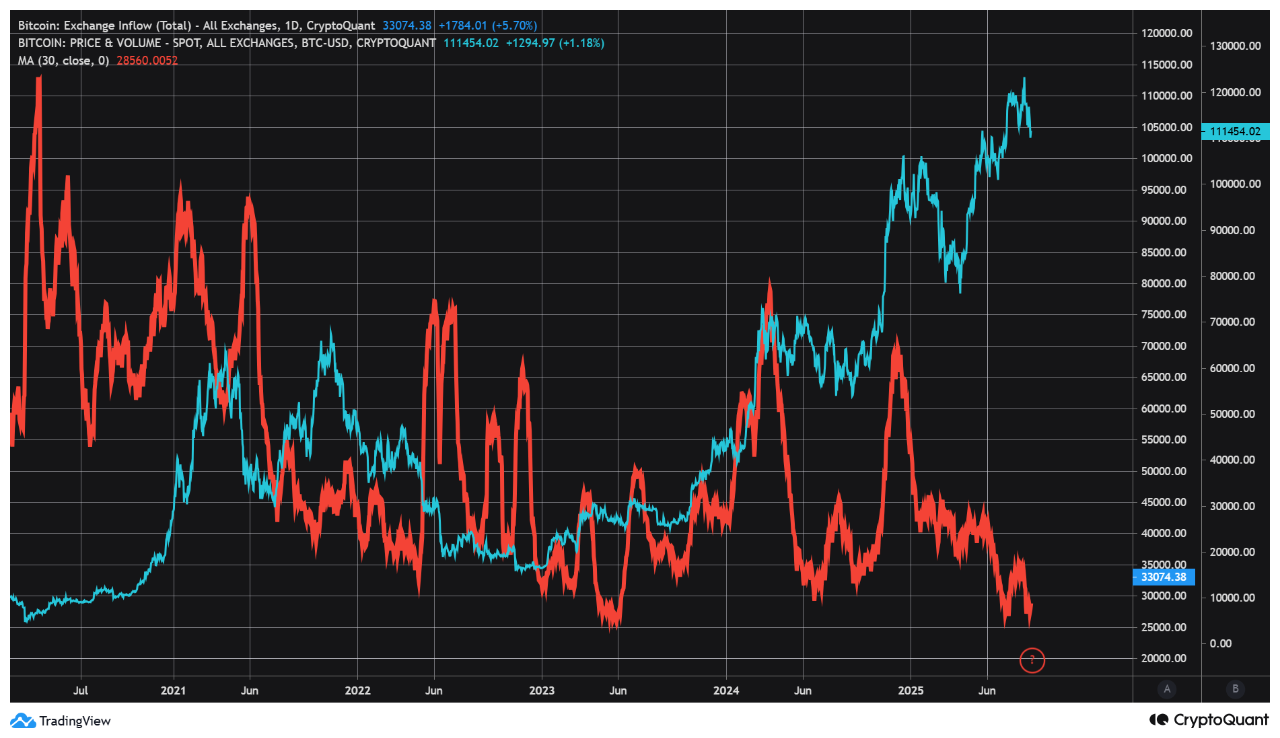
Backing this MVRV analysis, CryptoQuant revealed that the 30-day moving average of Bitcoin inflows to exchanges has dropped to its lowest level since May 2023.
A consistent decline in exchange inflows across platforms such as Coinbase and Binance points to lower selling pressure. Investors are increasingly choosing to hold their coins, reducing available supply as demand continues to rise.
Bitcoin exchange inflow across all exchanges | Source: CryptoQuant
BTC Price Analysis: Support and Resistance
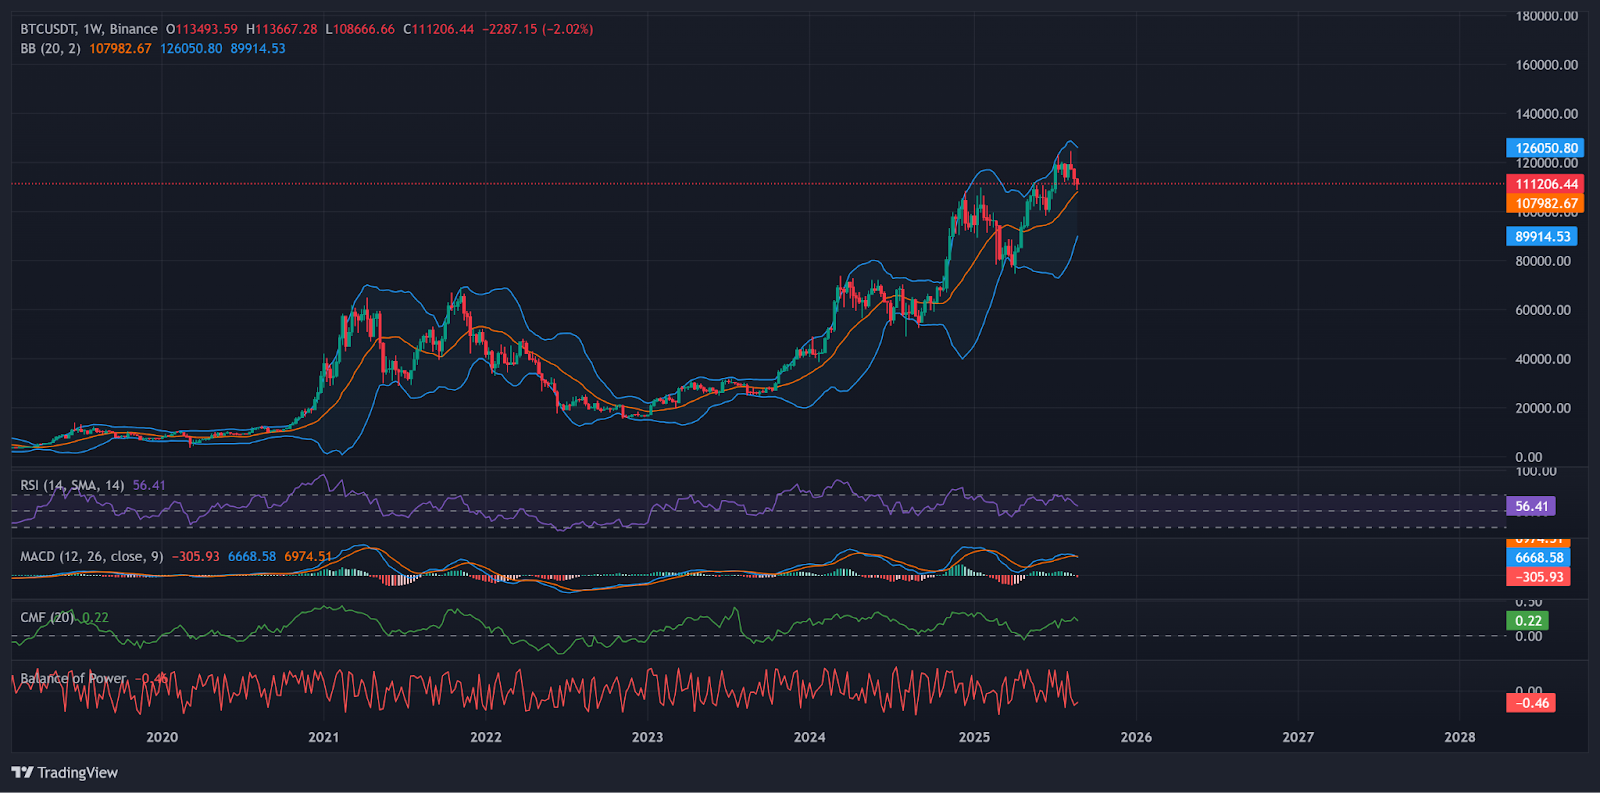
Bitcoin is trading around $111,200 after a strong rally. Weekly charts show the price consolidating near the upper Bollinger Band, signaling strength but also hinting at upcoming volatility.
The RSI sits near 56, suggesting room for further gains before overbought levels are reached. Meanwhile, the MACD remains in positive territory, though momentum appears to be slowing.
Bitcoin daily chart with momentum indicators as of Aug 27 | Source: TradingView
If Bitcoin can hold the $108,000–$110,000 support range, the next resistance sits between $120,000 and $126,000. A breakout above this level could open the path toward $135,000 or higher, making it one of the best crypto to buy in 2025.
On the downside, a pullback toward $90,000–$95,000 would not necessarily invalidate the broader bullish structure but would likely test investor conviction.
Disclaimer: Coinspeaker is committed to providing unbiased and transparent reporting. This article aims to deliver accurate and timely information but should not be taken as financial or investment advice. Since market conditions can change rapidly, we encourage you to verify information on your own and consult with a professional before making any decisions based on this content.
A crypto journalist with over 5 years of experience in the industry, Parth has worked with major media outlets in the crypto and finance world, gathering experience and expertise in the space after surviving bear and bull markets over the years. Parth is also an author of 4 self-published books.