Bitcoin SV Price Analysis: BSV/USD Trends of January 31–February 06, 2019
In case the bulls increase their momentum and the resistance level of $68 is broken up and the daily candle closed above the resistance level of $68, then, Bitcoin SV price may have its target at the range of $85 – $100 price level.
By Azeez Mustapha
Updated
2 mins readPhoto: Shutterstock
Key Highlights:
The bearish trend may discontinue in Bitcoin SV market;
in case the resistance level of $68 is broken up there will be a bullish rally;
the downtrend may continue in case the bears increase their pressure.
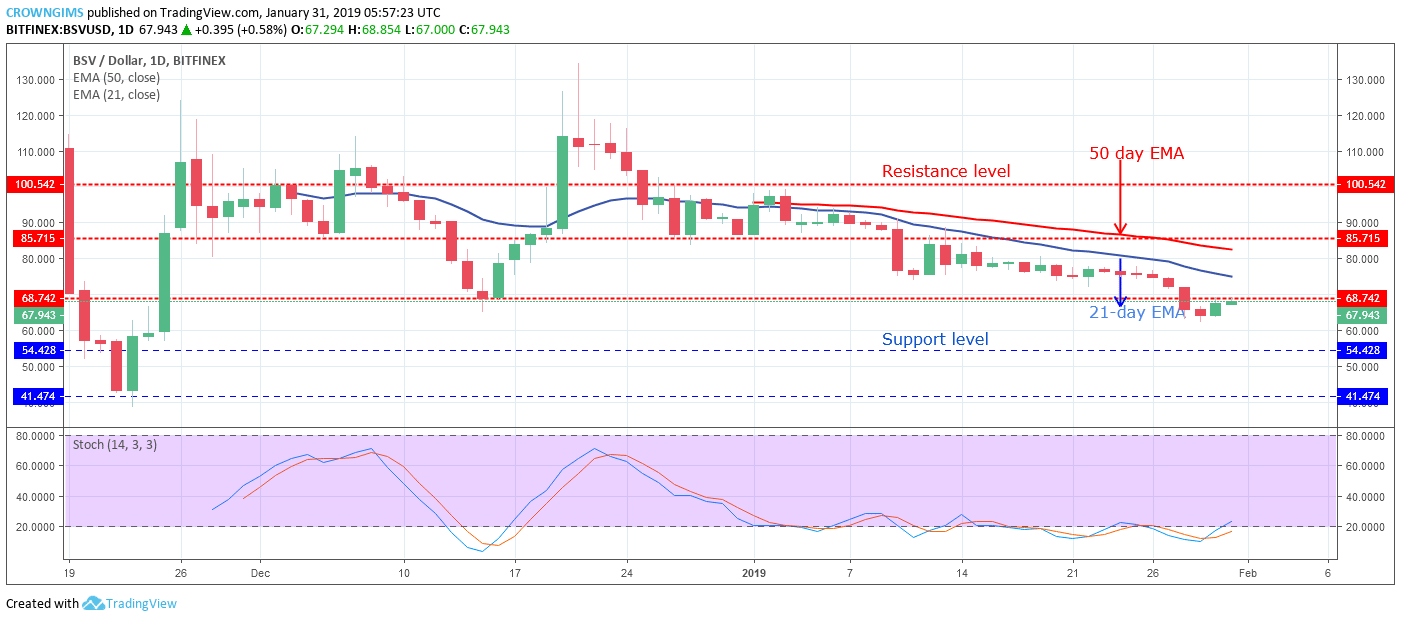
BSV/USD Price Long-term Trend: Bearish
Resistance levels: $68, $85, $100
Support levels: $54, $41, $30On the Long –term, BSV/USD is on the bearish trend; the cryptos broke out of the consolidation phase that lingered for more than a week. As it was predicted last week, the support level of $68 was reached and also broke down and the $54 support level was exposed by the Bears’ momentum. On January 30, the bullish engulfing candle formed which may push the coin up as a pullback unless the $68 resistance level is penetrated upward and close above the level.
The two EMAs are gradually farther apart with Bitcoin SV price below the 21-day and the 50-day EMA indicates that bears’ pressure is steadily increasing. The Stochastic Oscillator period 14 is at 20 levels and its signal lines pointing up connotes buy signal which may be a pullback.
In case the bulls increase their momentum and the resistance level of $68 is broken up and the daily candle closed above the resistance level of $68, then, Bitcoin SV price may have its target at the range of $85 – $100 price level.
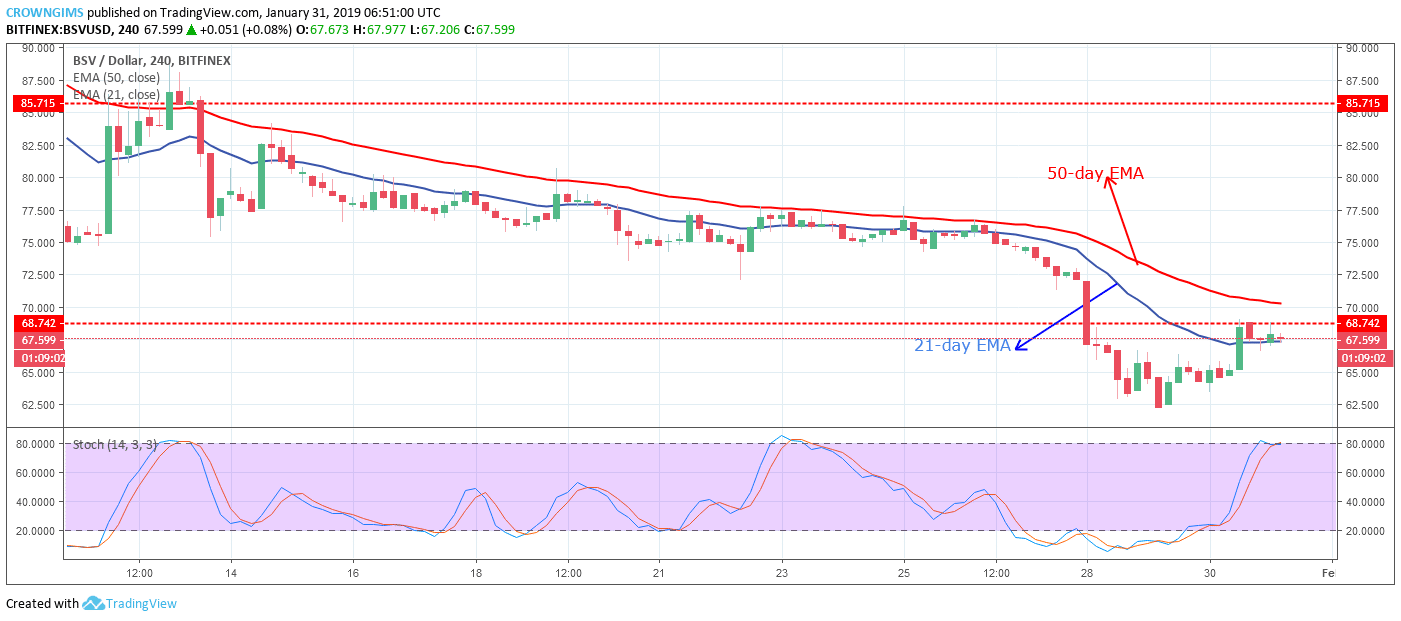
BSV/USD Price Medium-term Trend: Bearish
BSV/USD remains on the bearish trend on the medium-term outlook. Bitcoin SV moved farther away from the two EMAs on the 4-Hour chart last week connotes increase on the bears’ pressure until the inside bar candle pattern formed which turned the trend direction from down up as an indication that the bulls were returning into the BSV market.
The BSV price is retesting the broken level of $68 before continues its downtrend movement the price is trading and consolidating on the 21-day EMA and 50-day EMA is above the coin. The Stochastic Oscillator period 14 is at 80 levels (oversold level) and the signal lines interlocked to each other implies consolidation is ongoing. There is a probability for the coin to resume its downward trend as more bearish candles are emerging.
Azeez Mustapha is a specialist in Computer Studies (including DTP), Forex and Crypto trading professional. Being expert technical and currency analyst, as well as experienced fund manager and author of several books, Azeez places strong focus on crypto market studies conducting comprehensive price analyses and sharing forecasts of presumptive market trends.

 On the Long –term, BSV/USD is on the bearish trend; the cryptos broke out of the consolidation phase that lingered for more than a week. As it was predicted last week, the support level of $68 was reached and also broke down and the $54 support level was exposed by the Bears’ momentum. On January 30, the bullish engulfing candle formed which may push the coin up as a pullback unless the $68 resistance level is penetrated upward and close above the level.