Cardano Price Analysis: ADA/USD Trends of December 28–January 03, 2019
Should the bears maintain their momentum on Cardano market and breaks down the price level of $0.032, ADA price will use its previous low as its target.
By Azeez Mustapha
Updated
2 mins readPhoto: Shutterstock
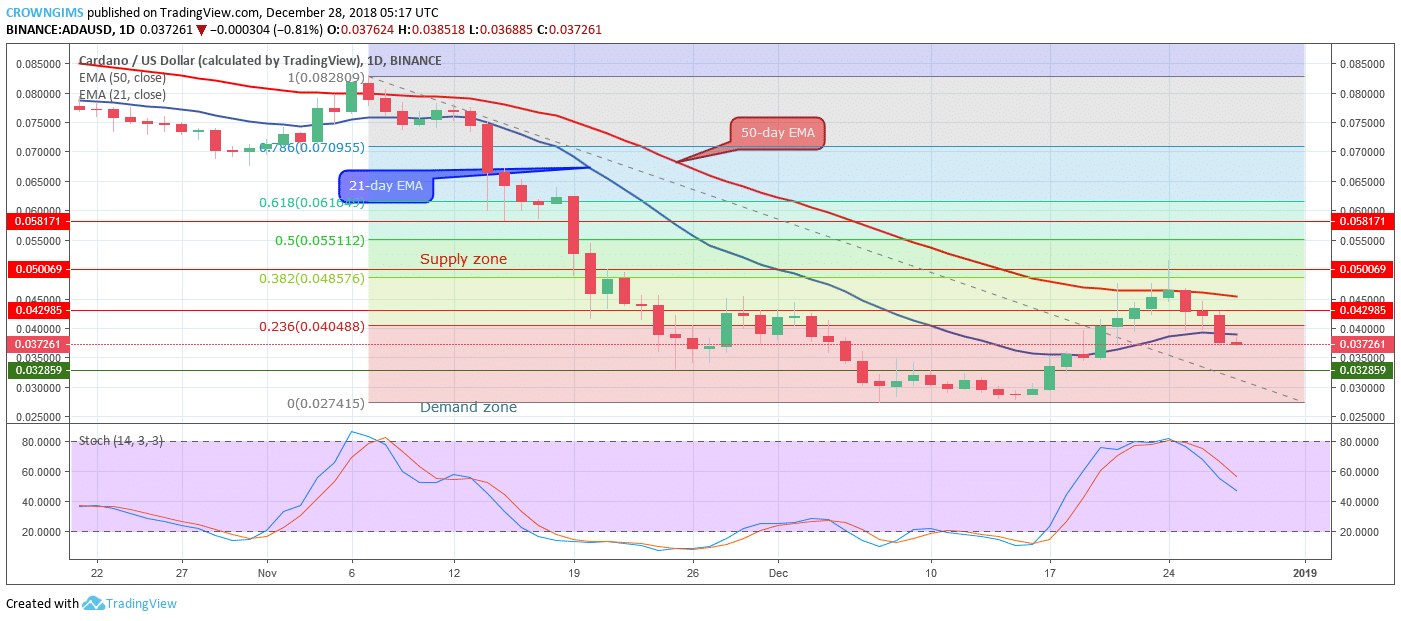
Supply Zones: $0.042, $0.050, $0.058
Demand Zones: $0.032, $0.027, $0.022ADA/USD turned to bearish trend on the long-term outlook. The bullish trend is not fully resumed until ADA price rally above the two EMAs. The last week bullish momentum of ADA price could not break and close the bullish candle above the supply zone of $0.050 and the 50-day EMA barrier. So, ADA made the two barrier zone as its turning point. As it can be seen on the daily chart with Fibonacci retracement, Cardano price had almost 50% retracement and it seems the price is returning to its previous low.
The cryptocurrency is trading currently below 21-day EMA and 50-day EMA after the bears’ momentum had broken down the price level of $0.042 and the two EMAs, that is to say, that ADA is under bear’s pressure. Should the bears maintain their momentum on ADA market and breaks down the price level of $0.032, Cardano price will use its previous low as its target. Meanwhile, the Stochastic Oscillator period 14 is at 50 levels with its signal lines pointing to the south, which indicates a strong sell signal.
ADA/USD Price Medium-term Trend: Bearish
Cardano is on the bearish trend on the medium-term outlook. The higher highs movement made by the bulls last week on the ADA market 4-Hour chart was terminated by the bears at the $0.05 supply level. The bearish engulfing candle formed at the price level signal the return of the bears with high pressure into the ADA market. The more strong and massive bearish candle was formed which penetrated the two EMAs downside and dropped Cardano price below the $0.042 price level.
Cardano is currently trading under the 21-day and 50-day EMA. The 21-day EMA is about crossing the 50-day EMA downside as an indication of bears’ pressure. The Stochastic Oscillator period 14 is at the oversold level which indicates that ADA price may fall further.
Azeez Mustapha is a specialist in Computer Studies (including DTP), Forex and Crypto trading professional. Being expert technical and currency analyst, as well as experienced fund manager and author of several books, Azeez places strong focus on crypto market studies conducting comprehensive price analyses and sharing forecasts of presumptive market trends.

 ADA/USD turned to bearish trend on the long-term outlook. The bullish trend is not fully resumed until ADA price rally above the two EMAs. The last week bullish momentum of ADA price could not break and close the bullish candle above the supply zone of $0.050 and the 50-day EMA barrier. So, ADA made the two barrier zone as its turning point. As it can be seen on the daily chart with Fibonacci retracement, Cardano price had almost 50% retracement and it seems the price is returning to its previous low.
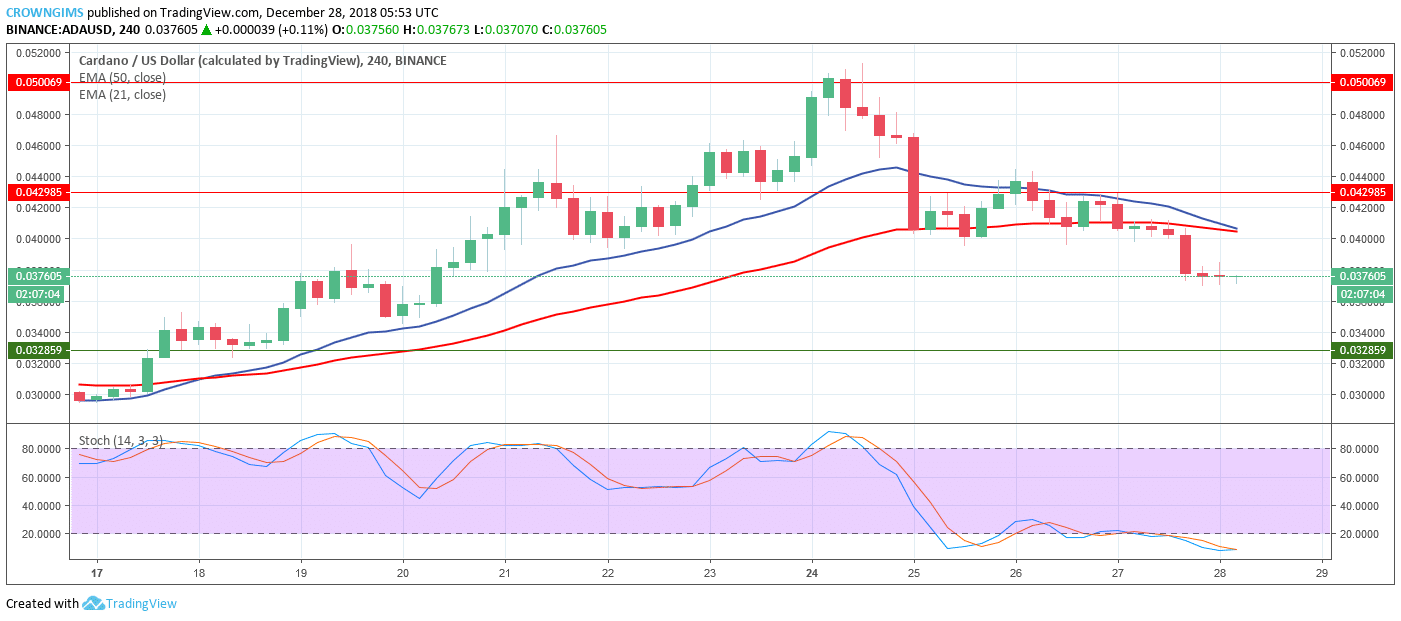 Cardano is on the bearish trend on the medium-term outlook. The higher highs movement made by the bulls last week on the ADA market 4-Hour chart was terminated by the bears at the $0.05 supply level. The bearish engulfing candle formed at the price level signal the return of the bears with high pressure into the ADA market. The more strong and massive bearish candle was formed which penetrated the two EMAs downside and dropped Cardano price below the $0.042 price level.