
Dmitriy Gurkovskiy, a senior analyst at foreign exchange broker RoboForex, provides his vision of the possible tendencies in price changes for Bitcoin as well as for other major cryptos.
For Bitcoin, a very important target is at $10.565, a breakout of which may push the major digital currency towards $13.000 or even higher. However, if bulls manage to break the closest support levels, the downside target for BTC/USD may be at $6.500. At the same time, the charts of Ethereum and TRON are also looking quite strong in favor of new growth. ETH/USD may easily reach and test $270 or even higher if, of course, it breaks the descending channel’s upside border.
Bitcoin
BTC/USD continues trading below the resistance level. There are risks of further decline. It’s very important for bulls to break $10.565 and resume the rising tendency. Such a scenario implies that the asset breaks the descending channel’s upside border. However, if the price falls lower than $8.545, this structure may be considered as a Double Top reversal pattern with the target at $6.320. A signal in favor of this idea is a rebound from the descending channel’s upside border. Another signal is the RSI indicator’s failure to fix above the resistance line. All this taken together indicate a serious bearish pressure.
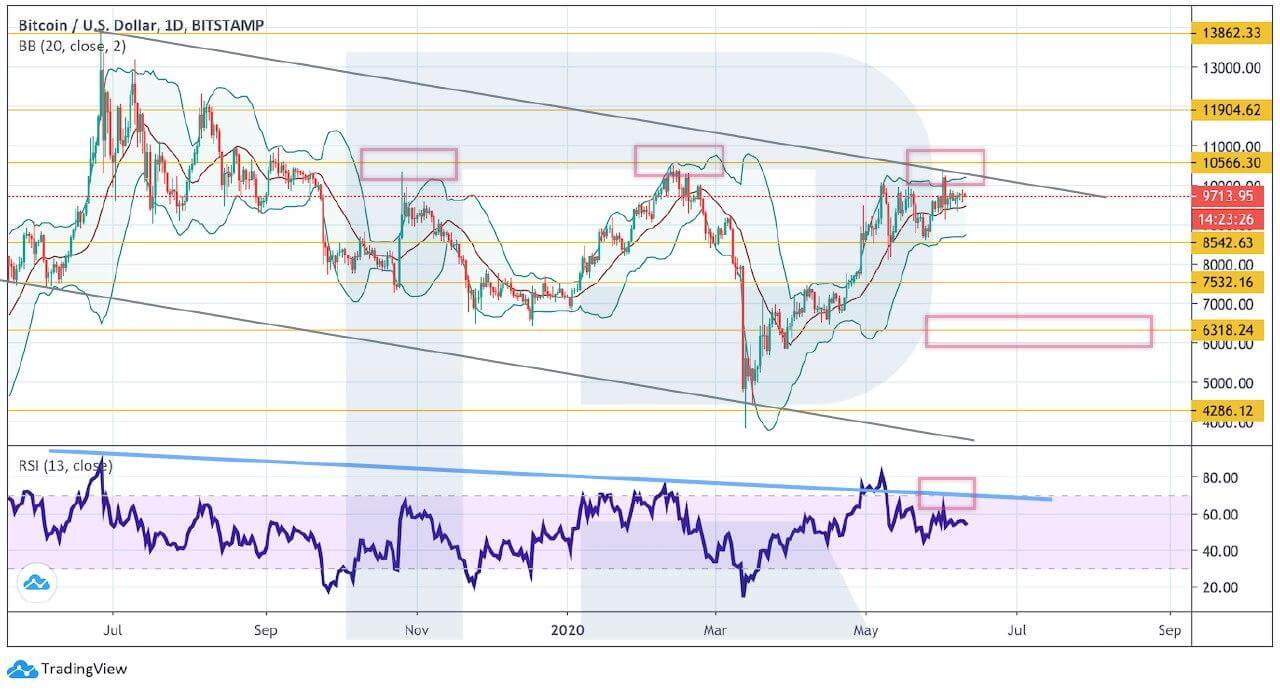
Photo: Roboforex / TradingView
As we can see in the H4 chart, the cryptocurrency is stuck between the resistance and support levels. Earlier, there was a potential for the formation of a Head & Shoulders reversal pattern that might have pushed the price downwards but the Right Shoulder is currently too high and may result in the cancelation of the pattern and further growth. A short-term trading idea implies that the asset may test $10.000 and then resume falling towards $9.270 or even break it to reach $8.555. However, if bulls manage to break $10.055, the instrument may continue trading upwards to reach $10.565 and resume the rising tendency on the daily chart.
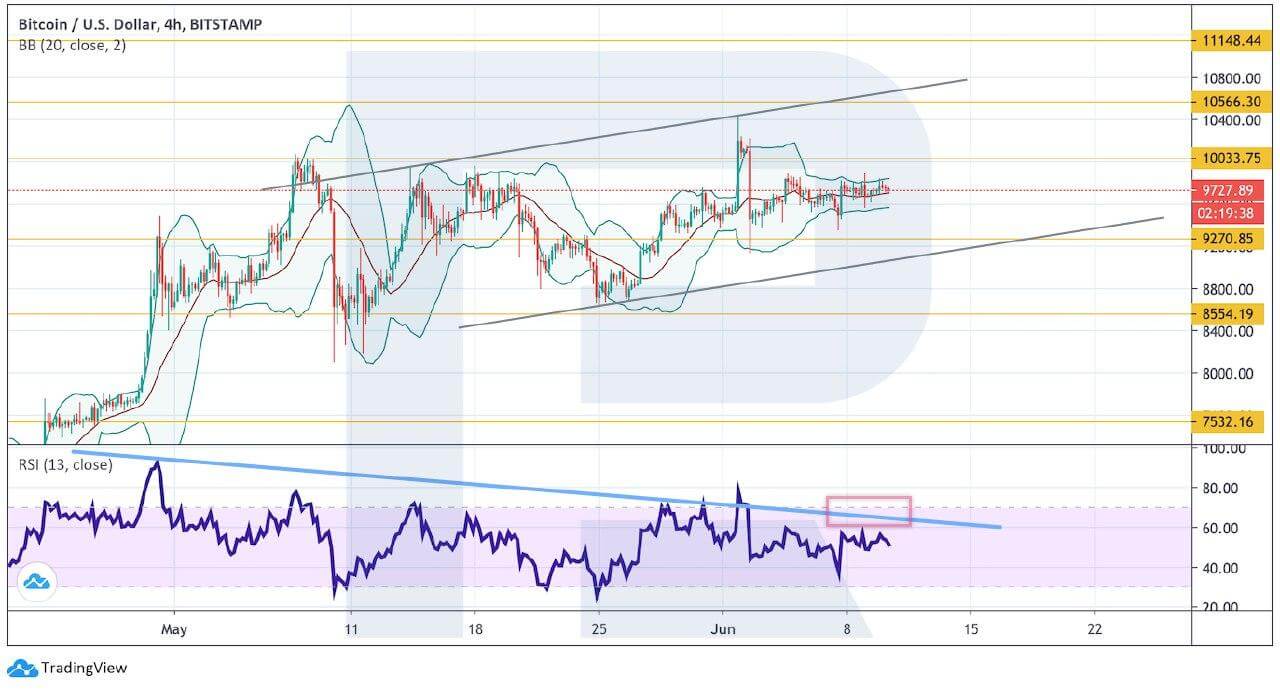
Photo: Roboforex / TradingView
Ethereum
In the daily chart, Ethereum is still testing the descending channel’s upside border. In general, the chart strongly implies further growth. However, to confirm this idea, the pair must break $255, thus leaving the channel and starting a proper bullish tendency. Still, if bears are able to break the support level and fix below $221, the instrument may continue trading downwards to reach $175. A strong signal in favor of this idea will be a rebound from the descending channel’s upside border and a rebound from the resistance line at the RSI.
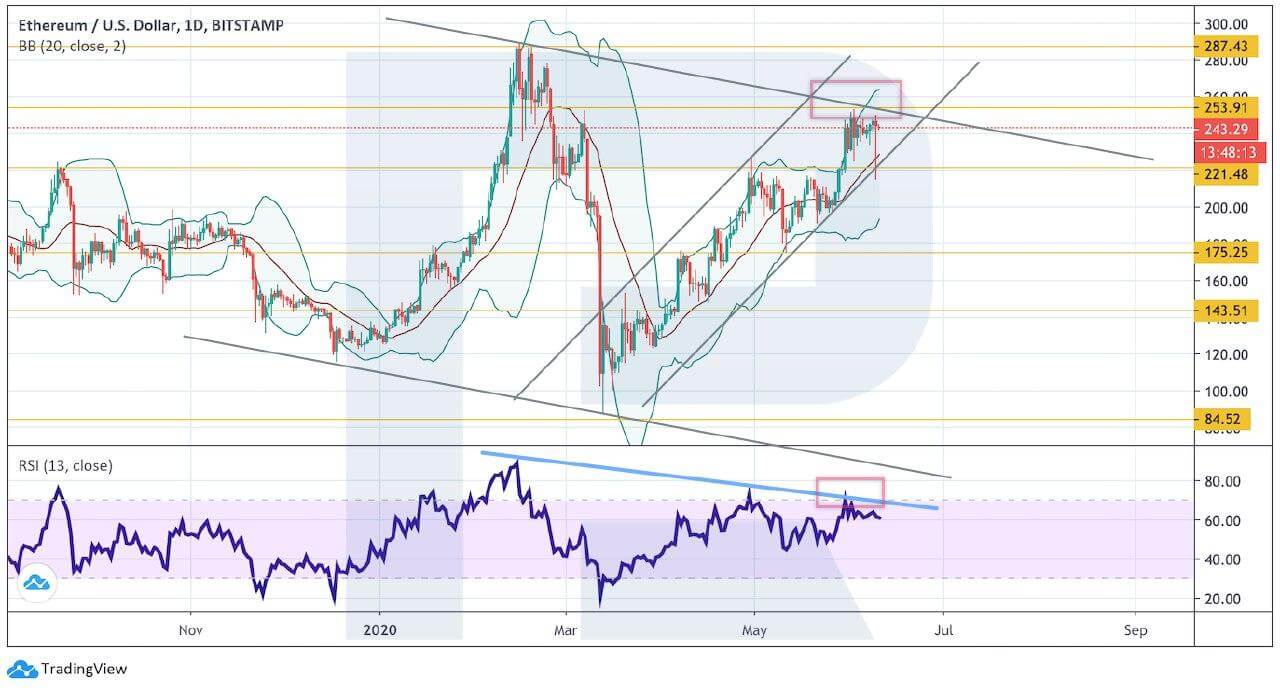
Photo: Roboforex / TradingView
On shorter timeframes, the cryptocurrency is stuck inside a Triangle pattern, thus indicating some uncertainty until the price leaves the pattern. The chart also points at a high probability of a breakout of the pattern’s upside border and further growth towards $270. A strong signal in favor of this idea is a rebound from the support line at the RSI. However, it’s very important for the asset to break the pattern’s upside border at $250. Still, this scenario may no longer be valid if the pair falls and fixes below $230. In this case, the asset may resume trading downwards to reach $175.
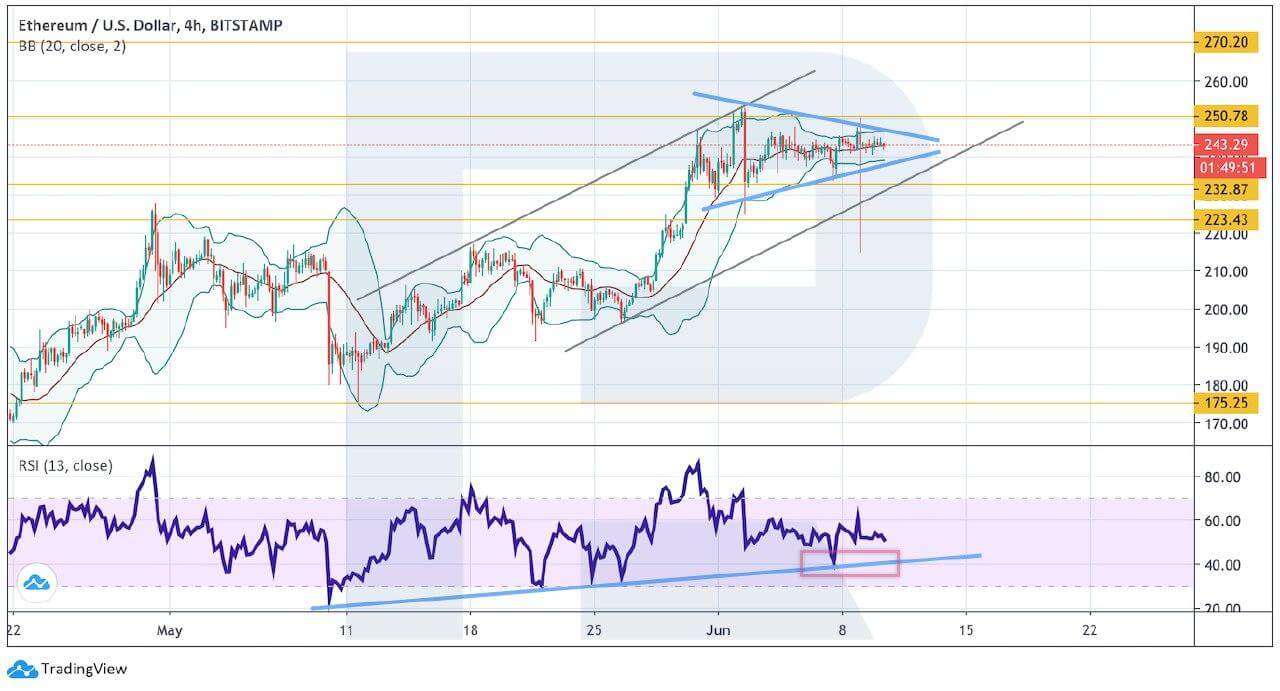
Photo: Roboforex / TradingView
Litecoin
As we can see in the daily chart, Litecoin continues the correction. One may assume that a Head & Shoulders pattern has transformed into a Triangle. However, a breakout of the pattern’s downside border here can also trigger further decline towards $24. Another signal in favor of this idea is a rebound from the resistance line at the RSI. Onу can only wait for the price to break $38 to confirm this scenario. Still, if the price skyrockets and fixes above $51, the instrument may resume the ascending impulse and continue trading upwards to reach $68.
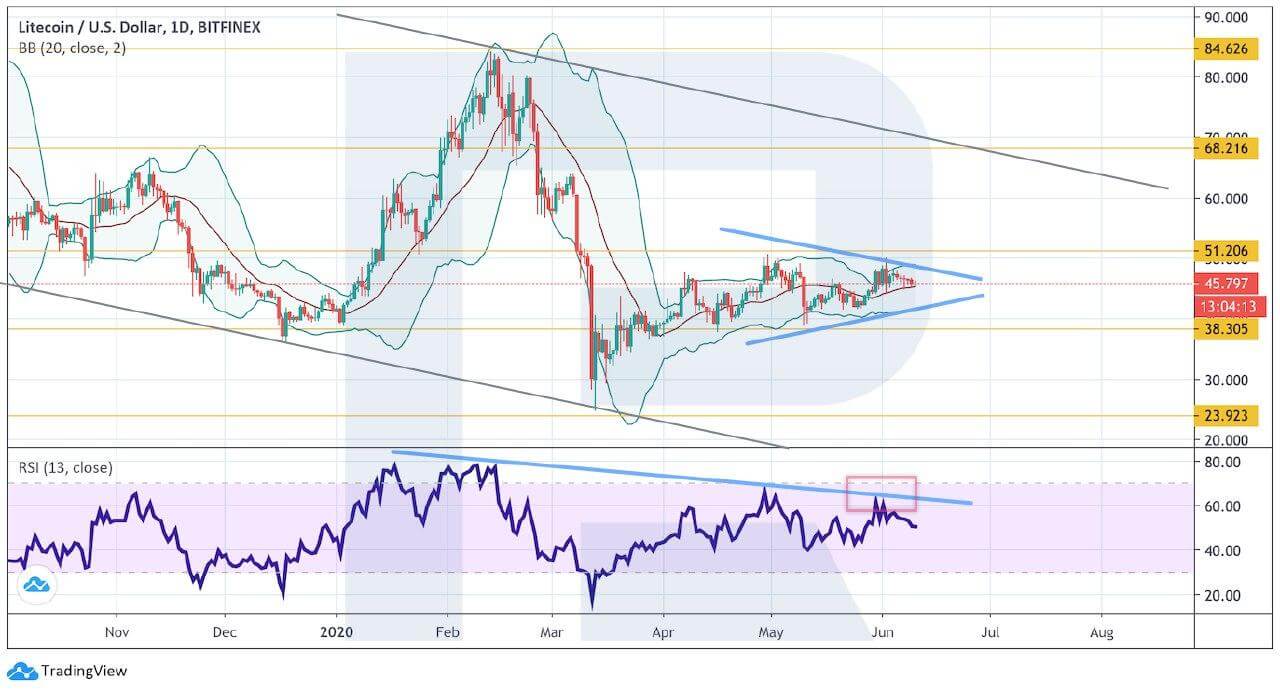
Photo: Roboforex / TradingView
In the H4 chart, LTC/USD is stuck inside a Triangle pattern. However, in this case, the RSI is already rebounding from the support level, thus indicating a possible rebound towards $48, a breakout of which may point at further growth within the uptrend in the daily chart of the asset. In the case of strong bearish pressure, the instrument may fix below $44 and then continue falling to reach $41 or even $38.
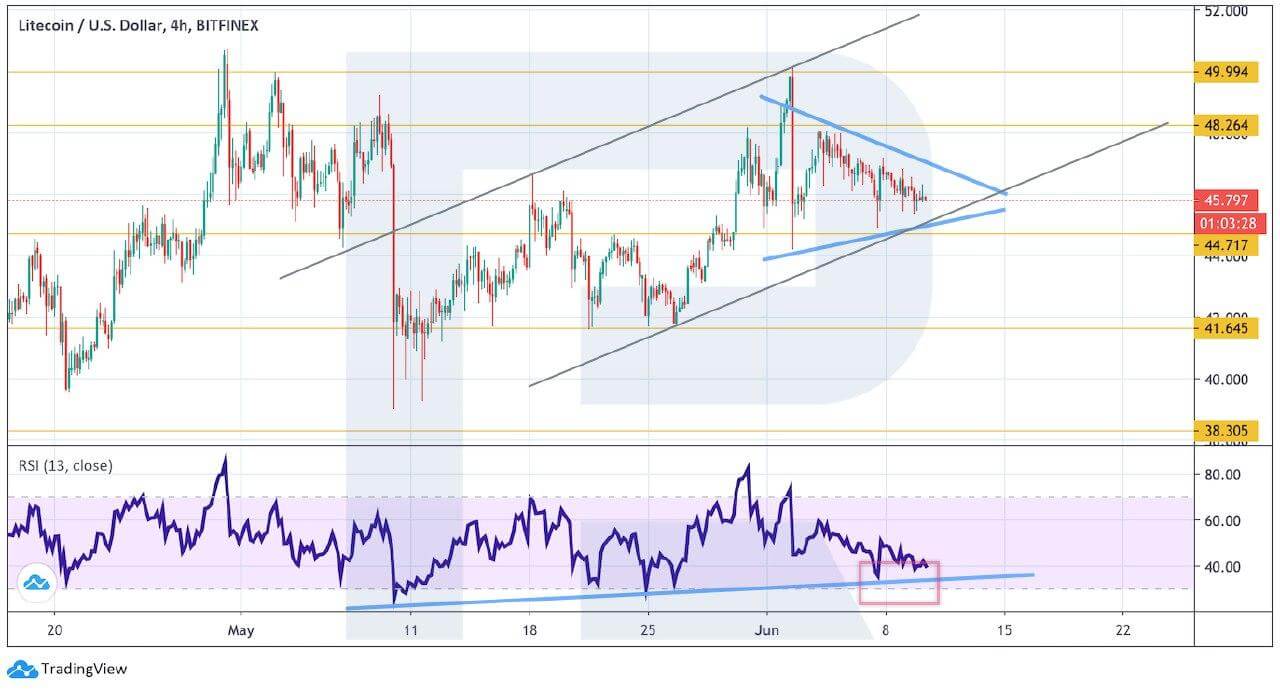
Photo: Roboforex / TradingView
Bitcoin Cash
After all, both bulls and bears have failed to make the asset break a Triangle pattern. Despite the fact that Moving Averages crossed, the pair isn’t moving upwards yet. Moreover, the RSI has rebounded from the resistance line, thus indicating further decline towards $136. To confirm this idea, the instrument must break the pattern’s downside border and fix below $243. However, if bulls manage to push the price past $280, the cryptocurrency may continue trading upwards to reach $356.
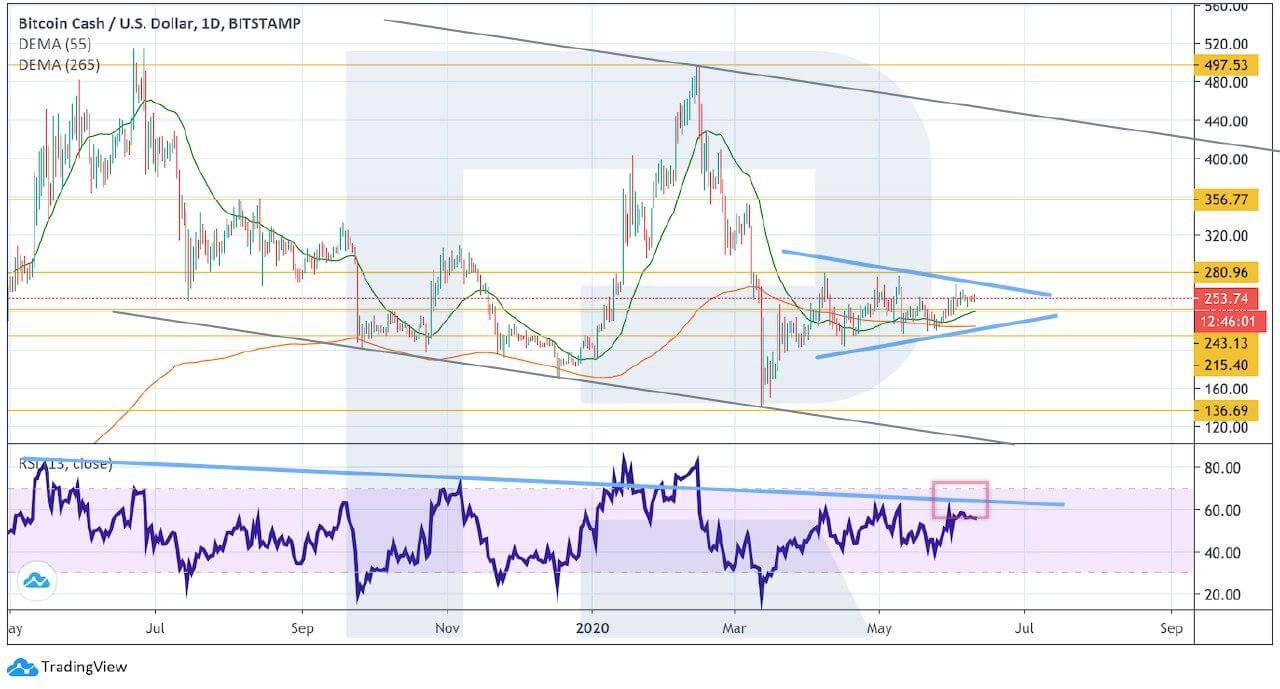
Photo: Roboforex / TradingView
As we can see in the H4 chart, Bitcoin Cash is stuck inside a Triangle pattern as well. At the moment, the price is growing inside the rising channel. The RSI has rebounded from the support line, that’s why one can expect an attempt to grow towards $264, a breakout of which may indicate further uptrend to reach $280. However, if the instrument breaks the rising channel’s downside border and fixes below $235, the cryptocurrency may continue falling.
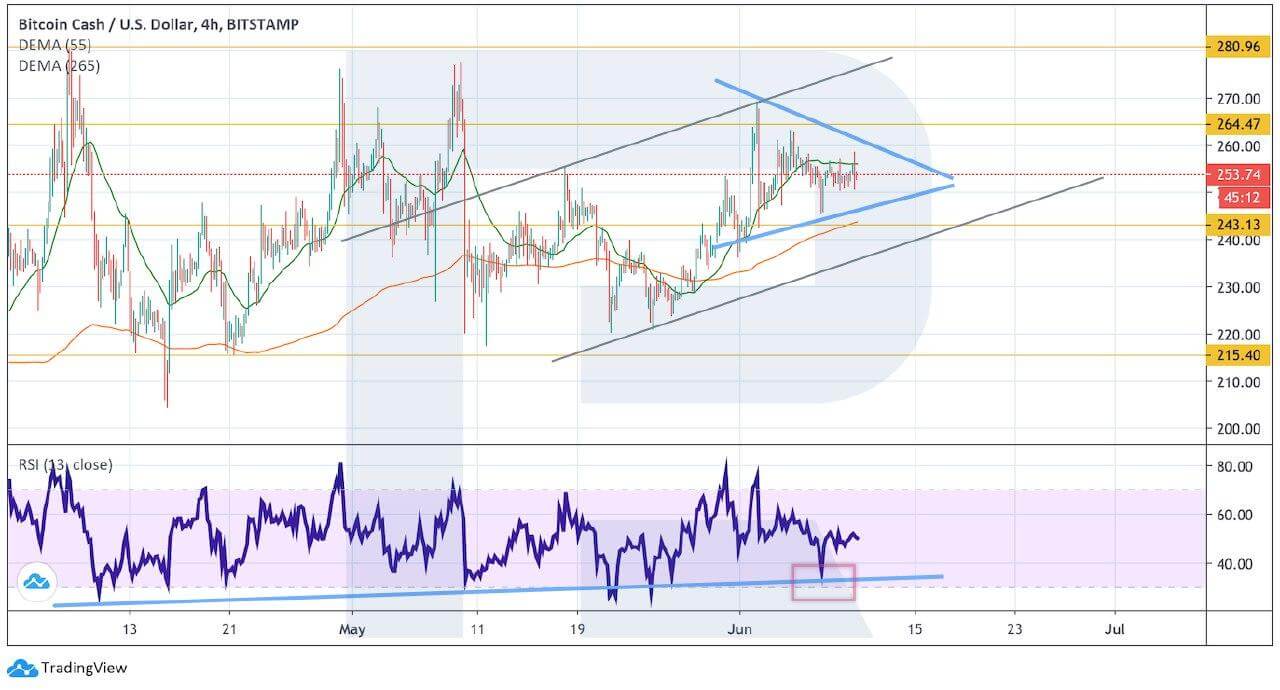
Photo: Roboforex / TradingView
TRON
As we can see in the daily chart, TRON continues its stumbling growth. To confirm a proper ascending impulse, the pair must break the descending channel’s upside border and fix above $0.021. in this case, the asset may continue trading upwards to reach $0.027. However, the RSI has rebounded from the resistance line, thus indicating a high probability of further decline towards $0.11. That’s why, after breaking the channel’s downside border, the instrument is expected to fall towards the closest support at $0.006.
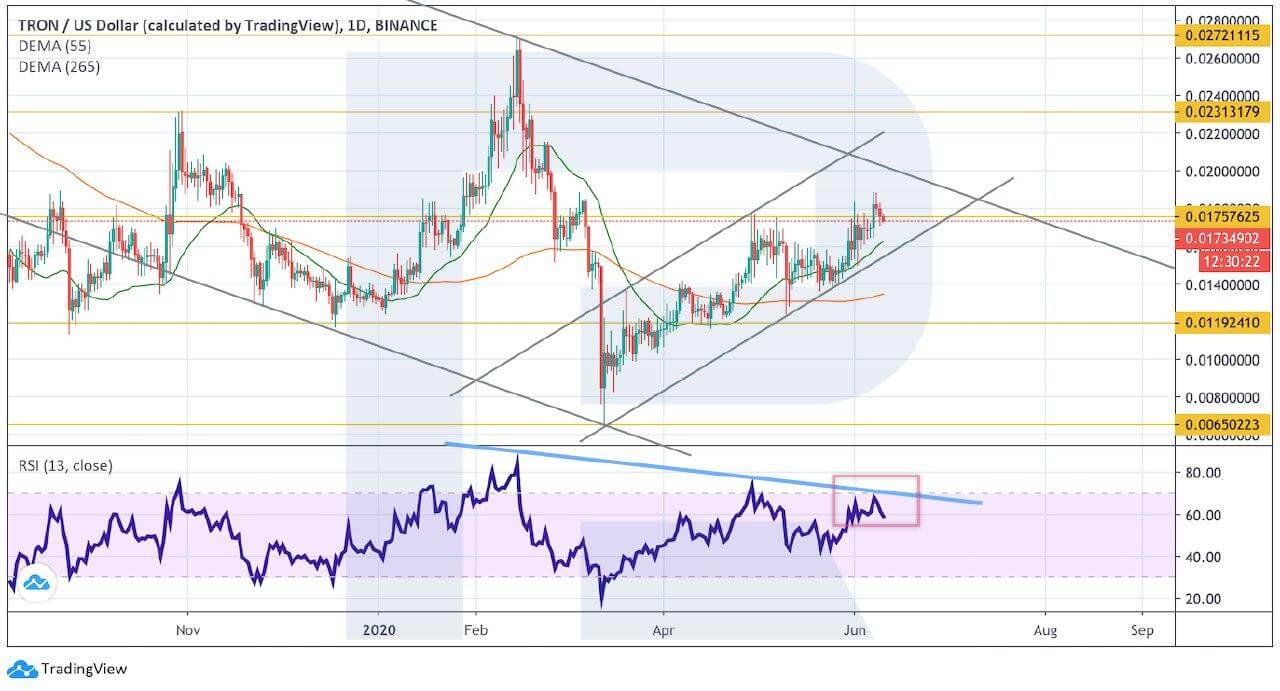
Photo: Roboforex / TradingView
On shorter timeframes, the cryptocurrency is growing within the rising channel. There is a potential for a test of the channel’s downside border at $0.016 and further growth towards $0.018 and $0.020. another signal in favor of this idea will be a rebound from the support line at the RSI. However, this scenario may no longer be valid if the instrument breaks the channel’s downside border. In this case, the asset may continue trading downwards with the target at $0.012.
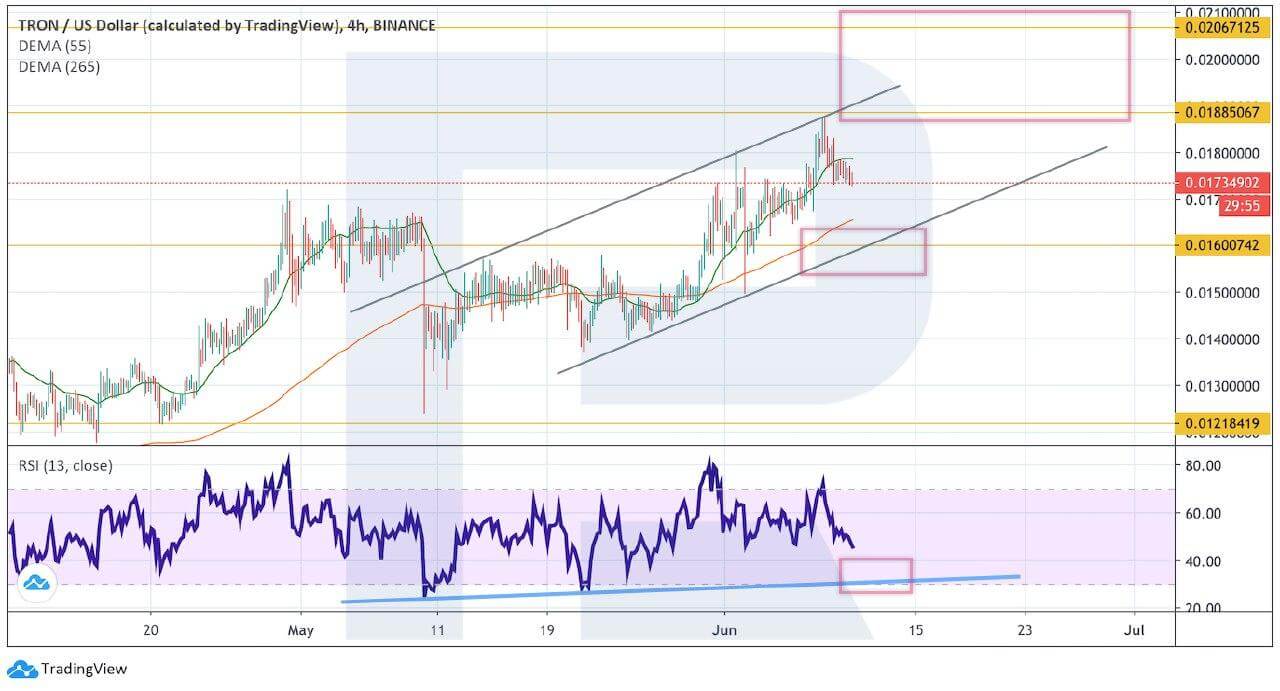
Photo: Roboforex / TradingView
Disclaimer: Coinspeaker is committed to providing unbiased and transparent reporting. This article aims to deliver accurate and timely information but should not be taken as financial or investment advice. Since market conditions can change rapidly, we encourage you to verify information on your own and consult with a professional before making any decisions based on this content.

Dmitriy Gurkovskiy is a senior analyst at RoboForex, an award-winning European online foreign exchange forex broker.


