Amid the chances of Bitcoin reclaiming the $100k mark this week, Ethereum is preparing for a bull run to $3,900. With the potential to regain strength against BTC, Ethereum targets a bullish January.
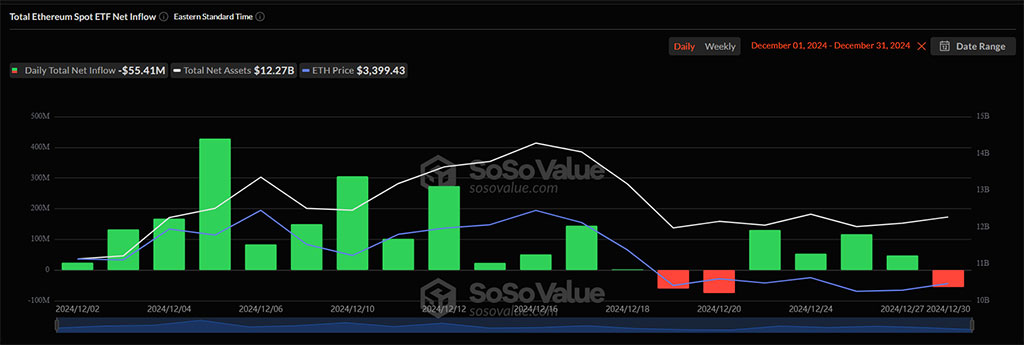
Institutional interest is surging, with December 2024 Ethereum ETFs netting $2.08 billion in inflows, led by Blackrock's ETHA fund.
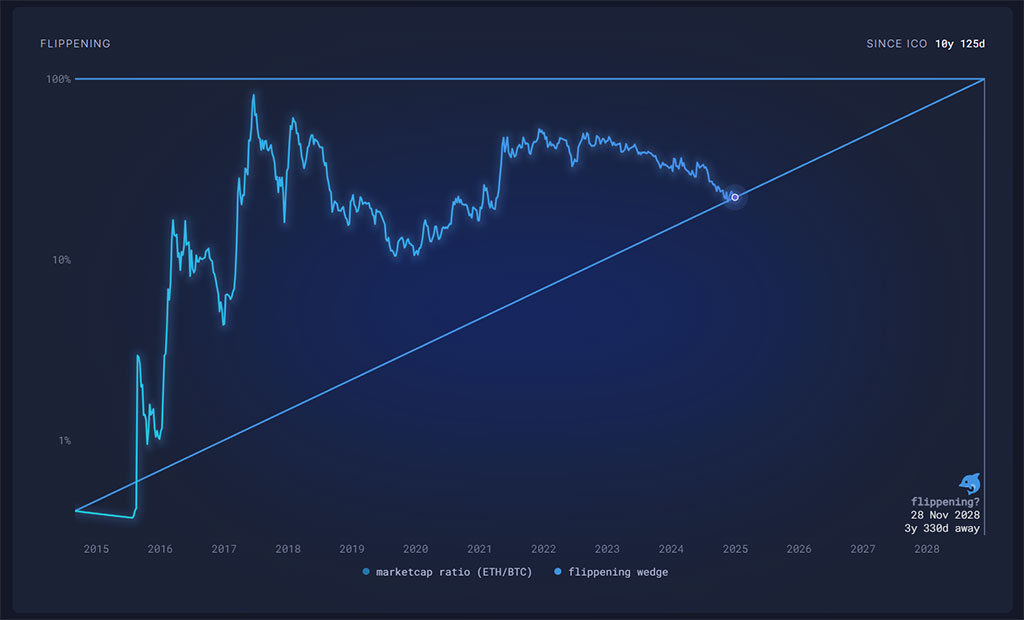
The flippening chances are at 22.22%, with Ethereum’s market cap underperforming Bitcoin, though a double-bottom reversal hints at a potential recovery.
Ethereum’s price is on a bullish trajectory, a breakout above $3,521 will set the next target at $3,900.
With Bitcoin price nearing the $97,000 mark, Ethereum ETH$1 58524h volatility:0.2%Market cap:$191.35 BVol. 24h:$10.67 B
is on a bullish track to recovery. Nearing the $3,500 psychological mark, the biggest altcoin in the market has jumped by 4.16% in the past 24 hours.
As Ethereum price is preparing for a massive trend reversal, the New Year rally is hinting at the altcoin crossing the $4,000 mark.
Will ETH Prices Cross the $3,500 Supply Zone?
In the 4-hour chart, the recovery run in Ethereum marks a breakout of a consolidation range. The consolidation range extended between the bottom support of $3,323 with the overhead ceiling at $3,415.
With bullish breakout, along with the bullish breakout, the Ethereum price trend has created seven consecutive bullish candles in the 4-hour chart. This marks a bullish comeback in Ethereum from the 23.60% Fibonacci level to challenge the 38.20% level.
In confluence with the overhead Fibonacci resistance, the 200 EMA line acts as a dynamic resistance. Beyond the short-term consolidation, the 38.20% Fibonacci level remains a key resistance in the ETH prices in the short term.
The Fibonacci resistance is in confluence with the $3,500 psychological mark, highlighting the high supply zone. Hence, the ongoing rally must sustain a bullish closure above $3,521 to signal a reversal.
Expecting a bullish comeback, the 4-hour RSI line is approaching the overbought boundary line, reflecting the surge in buying pressure. If the altcoin manages to exceed the immediate supply zone, the uptrend is likely to reach the 78.60% Fibonacci level near the $3,900 mark.
This will significantly increase the chances of Ethereum crossing the $4,000 barrier in early January 2025. On the flip side, a bullish failure to cross the supply zone will prolong the consolidation range with the bottom support remaining at 23.60% Fibonacci level at $3,338.
Blackrock Hypes the Institutional Support for Ethereum
Over the past month, the 10.15% pullback was captured by institutions as a discount opportunity. In December 2024, the nine Ethereum ETFs had over $2.08 billion in net inflows.
This is nearly double the amount of November’s net inflows, with Blackrock’s ETHA leading the rally. The ETHA fund accumulated $1.4 billion in net inflows, with 13 consecutive days of positive inflows.
This was followed by Fidelity’s FETH, with $752 million in inflows. As the institutional demand for Ethereum continues to surge, Ethereum flippening remains an under-discussed topic in the crypto market.
Is Ethereum Flippening Possible?
Ethereum flippening refers to a potential future where Ethereum’s market capitalization surpasses the digital gold, Bitcoin. At present time, this remains a pipe dream as the market cap of Bitcoin is near $2 trillion while Ethereum stands at $418 billion.
With a nearly 5 times difference between the market cap, the event of Ethereum flippening will mark a massive bull run in Ethereum. Currently, the flipping chances have been declining since the 2017 bull run.
The flippening chances peaked at 81.5% on June 19, 2017, and at nearly 50% during the 2021 bull run. Since then, with the pullback in the Ethereum prices and the massive growth in Bitcoin due to the ETF listing and the “Trump pump” phase, the flippening chances have been down to 22.22%.
While the flippening is projected still 3 years and 327 days away, the short-term pullback in the flippening chances reveals the underperformance of Ethereum in comparison to Bitcoin.
However, with the broader market anticipating a bullish comeback in altcoins, the Ethereum to BTC chart showcases the possibility of a bullish comeback.
Despite Ethereum weakening by 7.13% against Bitcoin in December, the weekly chart hints at a potential comeback with a double-bottom reversal. Supporting the reversal chances, the weekly RSI line reveals a bullish divergence.
Considering Ethereum price manages to outperform multiple tokens, the breakout of the short-term resistance line will challenge a long-standing resistance near 0.04619 BTC.
Disclaimer: Coinspeaker is committed to providing unbiased and transparent reporting. This article aims to deliver accurate and timely information but should not be taken as financial or investment advice. Since market conditions can change rapidly, we encourage you to verify information on your own and consult with a professional before making any decisions based on this content.
Vishal, a Bachelor of Science graduate, began his journey in the crypto space during the 2021 bull run and has since navigated the subsequent market winter. With a strong technical background, he is dedicated to delivering insightful articles rich in technical details, empowering readers to make well-informed decisions.