Ethereum Needs Massive Rally for ETF Staking to Materialize Further Gains
Despite growing excitement around ETF staking approvals, Ethereum’s price action remains the bigger hurdle to attracting investors, according to Balchunas.
In a recent podcast, Balchunas said staking would only offer marginal support to fund inflows for ETFs. According to him, the real issue is Ethereum’s lack of sustained price momentum.
Historical data supports his point: during Ether’s 71% rally in late 2024, ETF inflows surged for 19 straight days, pulling in over $2.44 billion. But since hitting $4,107 in December, Ether has plunged over 56%, and is now hovering near $1,805.
Whales Sell, Traders Wait
Notably, Ethereum did record a short-lived rally earlier this month, bouncing from $1,438 to $1,840. However, on-chain data shows whales offloaded 262,000 ETH, worth around $445 million, between April 9 and April 26.
This distribution phase has affected bullish sentiment amid growing ETF staking talks. Balchunas argued that another sharp rally could quickly shift the ETF landscape.
At the time of writing, Ether is trading around $1,805, down by around 1% in the past day. Popular crypto YouTuber Crypto Rover states that the second-largest cryptocurrency is “insanely” undervalued.
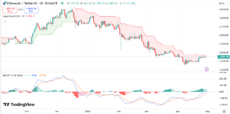
On the daily ETH price chart, the SuperTrend indicator is still flashing a “Sell” signal. A daily close above $1,950 is essential to flip this into a bullish confirmation.
ETH price chart | Source: TradingView
MACD has crossed into positive territory, suggesting momentum may be building. However, the histogram’s height warns of slowing upward pressure. If the token breaks above the $1,950 zone, it could ses a rally to $2,120.
RSI stands at 55.66 with an upward gradient, indicating a mild bullish bias with sufficient room for bulls.
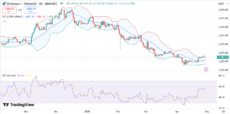
ETH price chart | Source: TradingView
Bollinger Bands are beginning to widen after a squeeze, hinting at a potential breakout. The price is approaching the upper band near $1,880. However, failure to hold above the mid band (20-day SMA) at $1,730 could lead ETH to $1,680 and potentially to the $1,600 zone.
Meanwhile, the ETH/BTC pair is currently at a historic Bottom. Several analysts have projected that the struggling period for the token could be over and suggested investors buy the dip.
Disclaimer: Coinspeaker is committed to providing unbiased and transparent reporting. This article aims to deliver accurate and timely information but should not be taken as financial or investment advice. Since market conditions can change rapidly, we encourage you to verify information on your own and consult with a professional before making any decisions based on this content.
A crypto journalist with over 5 years of experience in the industry, Parth has worked with major media outlets in the crypto and finance world, gathering experience and expertise in the space after surviving bear and bull markets over the years. Parth is also an author of 4 self-published books.