Ethereum Price Analysis: ETH/USD is Awaiting Break Out at $134 Price Level
Radical pressure is required from the bears to break down the $134 demand level; this will enable Ethereum price to find support at $125. If the $134 demand level holds and the bulls gain momentum, ETH may have the supply zone of $149 as its target.
By Azeez Mustapha
Updated
2 mins readPhoto: QuoteInspector
Key Highlights:
The Bears and the Bulls momentum are at equilibrium;
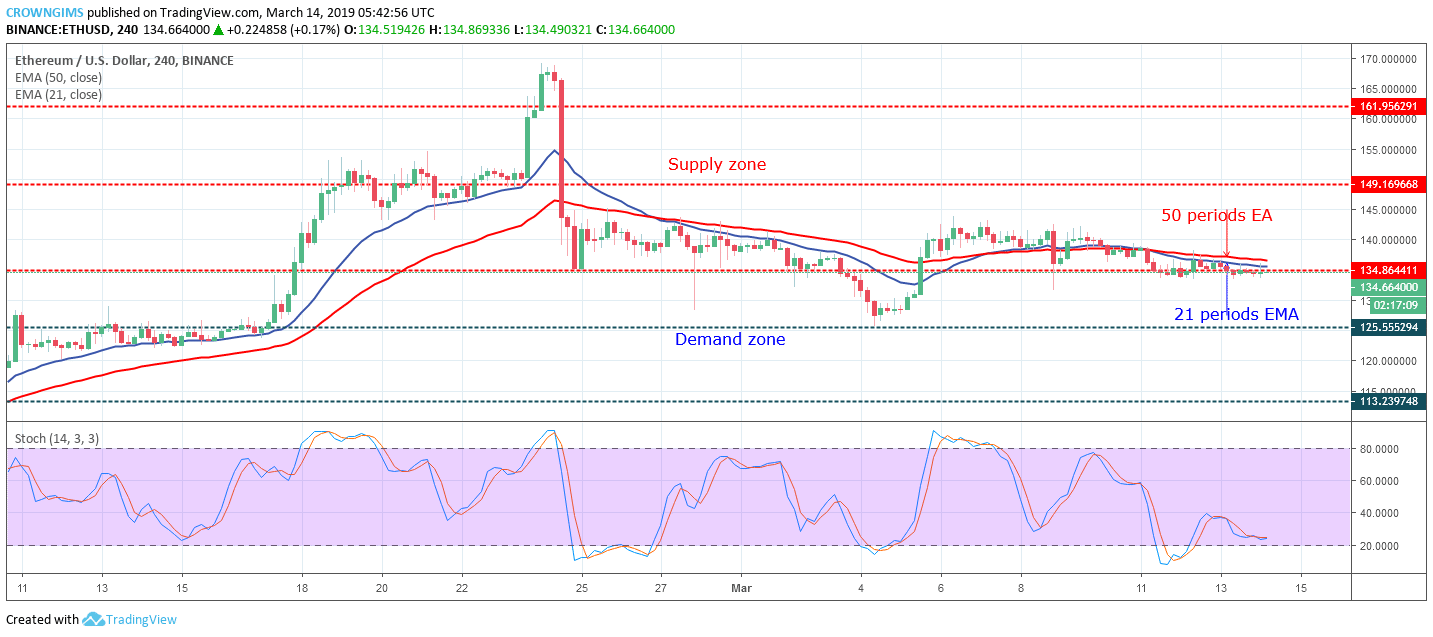
Supply Zones: $134, $149, $161
Demand Zones: $125, $113, $101On the 4-Hour chart, ETH/USD is ranging. The bearish momentum that placed the coin below the two dynamic support levels (21 periods and 50 period EMA) is weakened. Therefore, it is difficult for Ethereum price to penetrate the demand zone of $134. Likewise, the Bulls have lost the pressure and it is hard for them to push up the price.
Then, ETH/USD is consolidating at $134 price level. That means the buyers and the sellers momentum are at equilibrium. Radical fundamental events may be needed to make the coin rally.
The cryptocurrency is consolidating below the 21 periods EMA and 50 periods EMA and the two EMAs are close to each other. The Stochastic Oscillator period 14 is above 20 levels horizontally flat at the level showing no direction confirm the consolidation that is ongoing in the ETH market.
Radical pressure is required from the bears to break down the significant demand level of $134 and this will enable Ethereum price to find support at $125 price level. Alternatively, In case the $134 demand level holds and the bulls gain enough momentum, the coin may have the supply zone of $149 as its target.
ETH/USD Short-term Trend: Bearish
On the medium-term outlook, ETH price is bearish. The ETH price remains under the bearish pressure as it is clearly seen on the 1- Hour chart that the coin has been trading under the 21 periods EMA and 50 periods EMA for more than five days which is one of the evidence of the bearish trend.
The 21 periods EMA crossed down the 30 period EMA when the bearish candle penetrated the two EMAs downside on March 8. All attempts made by the bulls to push up Ethereum price failed due to an increase in bears’ momentum. The Stochastic Oscillator period 14 is at 40 levels pointing down which connotes sell signal.
Azeez Mustapha is a specialist in Computer Studies (including DTP), Forex and Crypto trading professional. Being expert technical and currency analyst, as well as experienced fund manager and author of several books, Azeez places strong focus on crypto market studies conducting comprehensive price analyses and sharing forecasts of presumptive market trends.

 On the 4-Hour chart, ETH/USD is ranging. The bearish momentum that placed the coin below the two dynamic support levels (21 periods and 50 period EMA) is weakened. Therefore, it is difficult for Ethereum price to penetrate the demand zone of $134. Likewise, the Bulls have lost the pressure and it is hard for them to push up the price.
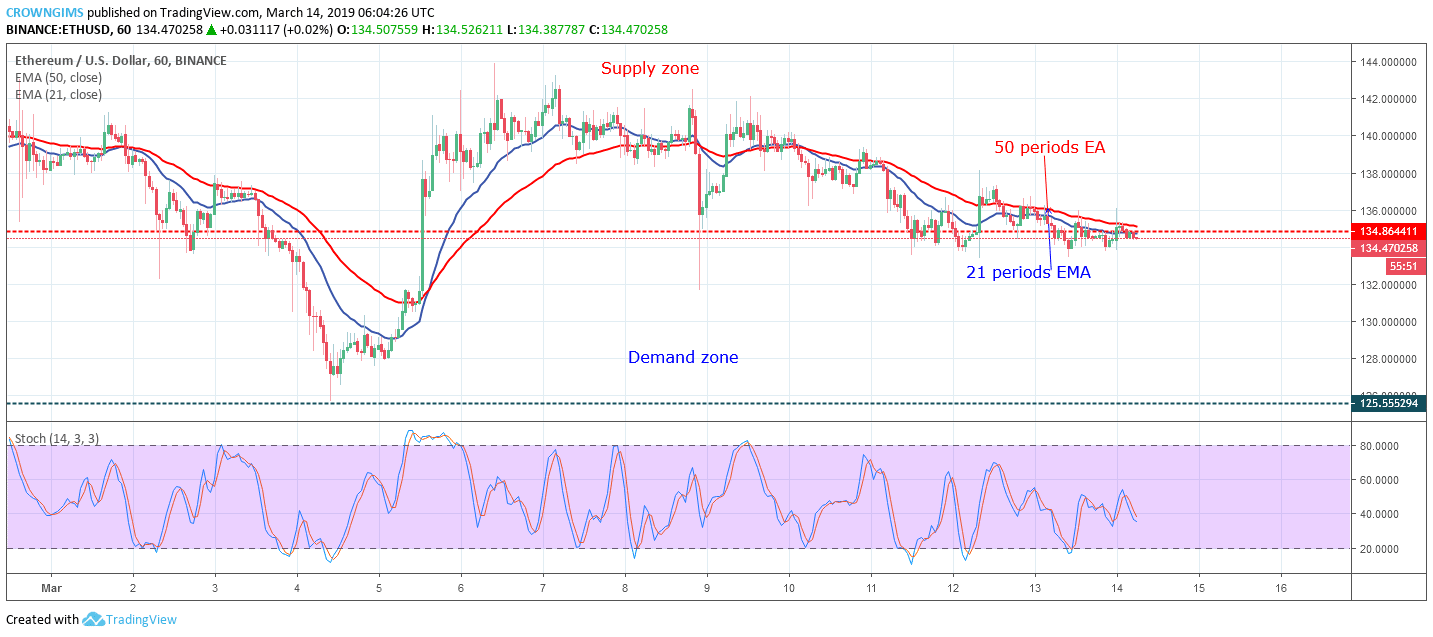 On the medium-term outlook, ETH price is bearish. The ETH price remains under the bearish pressure as it is clearly seen on the 1- Hour chart that the coin has been trading under the 21 periods EMA and 50 periods EMA for more than five days which is one of the evidence of the bearish trend.


