Ethereum Price Analysis: ETH/USD Remains Near $140, Targets $143
The increase in Bullish momentum will increase Ethereum price to reach $143 – $146 price level. In case the Bears defend supply level of $140, the ETH price will decline towards $136 – $134 price level.
By Azeez Mustapha
Updated
2 mins readPhoto: QuoteInspector
Key Highlights:
The $134 price level was the bullish turning point in Ethereum market;
Ethereum price may reach $143 – $146 price level;
price retracement is ongoing in the ETH market.
ETH/USD Medium-term Trend: Bullish
Supply Zones: $140, $143, $146
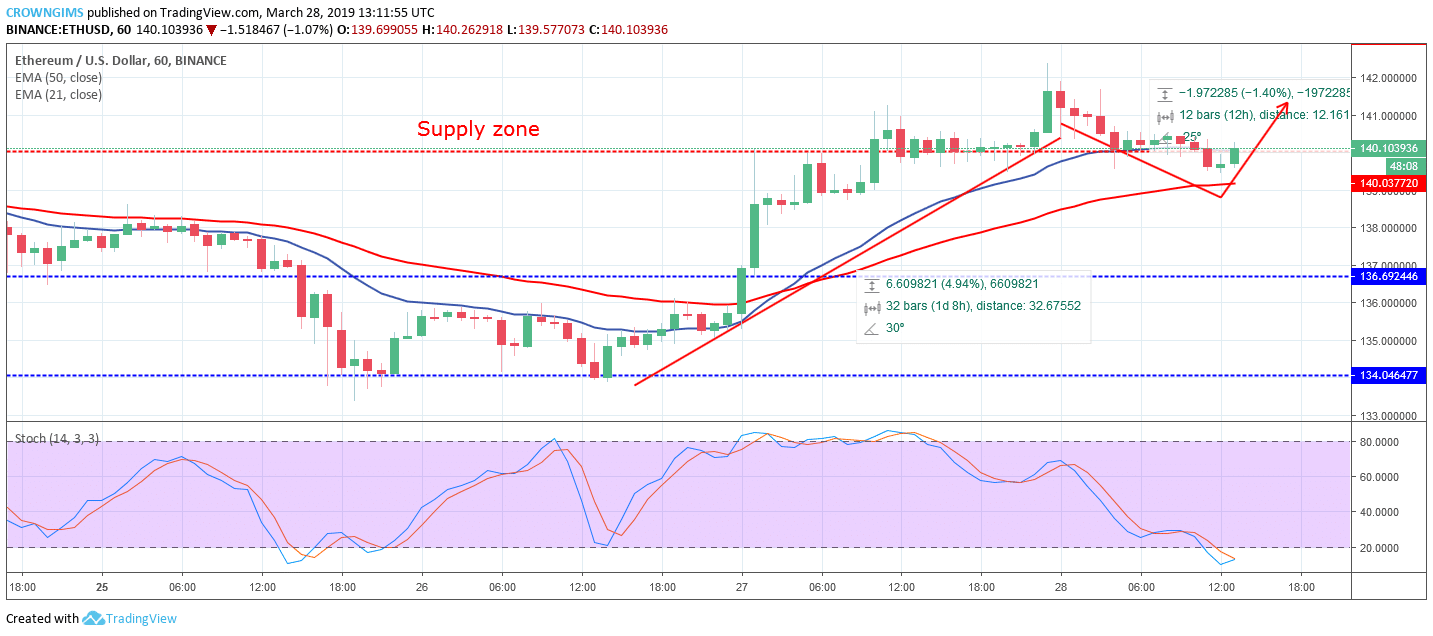
Demand Zones: $136, $134, $131On the medium-term outlook, ETH is on the bullish trend. Three days ago, the coin was inside the descending wedge on a bearish movement. On March 26, the doji candle formed followed by a strong bullish candle that broke out of the wedge at the upper trend line.
The coin broke up the $136 price level and extended to the supply level of $140. The supply zone of $140 could not hold and Ethereum price reached the supply zone of $143. The bears are currently returning the price to the broken level as a retest or price retracement.
The 21 periods EMA is crossing the 50 periods EMA and Ethereum price is trading above the two EMAs which indicate a strong bullish trend. The Stochastic Oscillator period 14 is above 60 levels and the signal lines bending down to indicate sell signal which may be a pullback. The increase in Bullish momentum will increase the ETH price to reach $143 – $146 price level. In case the Bears defend supply level of $140, the ETH price will decline towards $136 – $134 price level.
ETH/USD Short-term Trend: Bullish
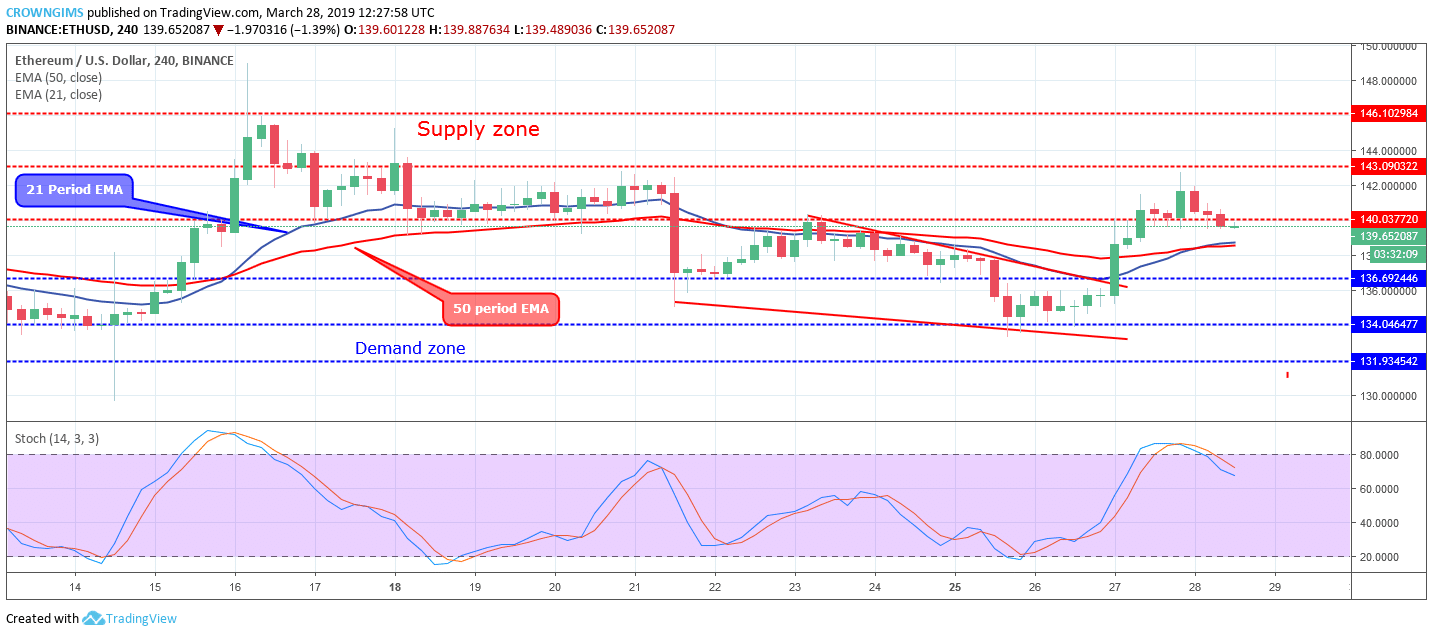
On the medium-term outlook, Ethereum price is bullish. The bearish momentum experienced in the ETH market last three days bottomed the coin at $134 price level. Immediately, a bullish engulfing candle pattern emerged that signaled the Bulls’ presence with high momentum.
This propelled the ETH price towards the north and broke up the demand zone of $136 and the supply zone of $140 and the price moved towards the supply zone of $143 before it was interrupted by the bears.
The Stochastic Oscillator period 14 is at 20 levels (oversold region) and the signal lines bending down indicate further decrease in Ethereum price before the coin return to its bullish trend. There is a possibility for a further increase in the ETH price after the pullback.
Azeez Mustapha is a specialist in Computer Studies (including DTP), Forex and Crypto trading professional. Being expert technical and currency analyst, as well as experienced fund manager and author of several books, Azeez places strong focus on crypto market studies conducting comprehensive price analyses and sharing forecasts of presumptive market trends.

 On the medium-term outlook, ETH is on the bullish trend. Three days ago, the coin was inside the descending wedge on a bearish movement. On March 26, the doji candle formed followed by a strong bullish candle that broke out of the wedge at the upper trend line.