Ethereum Price Analysis: ETH/USD Trends of February 26–March 04, 2019
Should the bears increase its pressure, support zone of $134 will be broken and the coin may find its low at $114 – $101, but in case the demand zone of $134 holds, there will be a bullish rally of Ethereum price towards the previous high of $161.
By Azeez Mustapha
Updated
2 mins readPhoto: Shutterstock
on the 4-Hour chart, the Bears prevailed over the Bulls;
ETH price will rally towards $161 in case $134 demand zone hold.
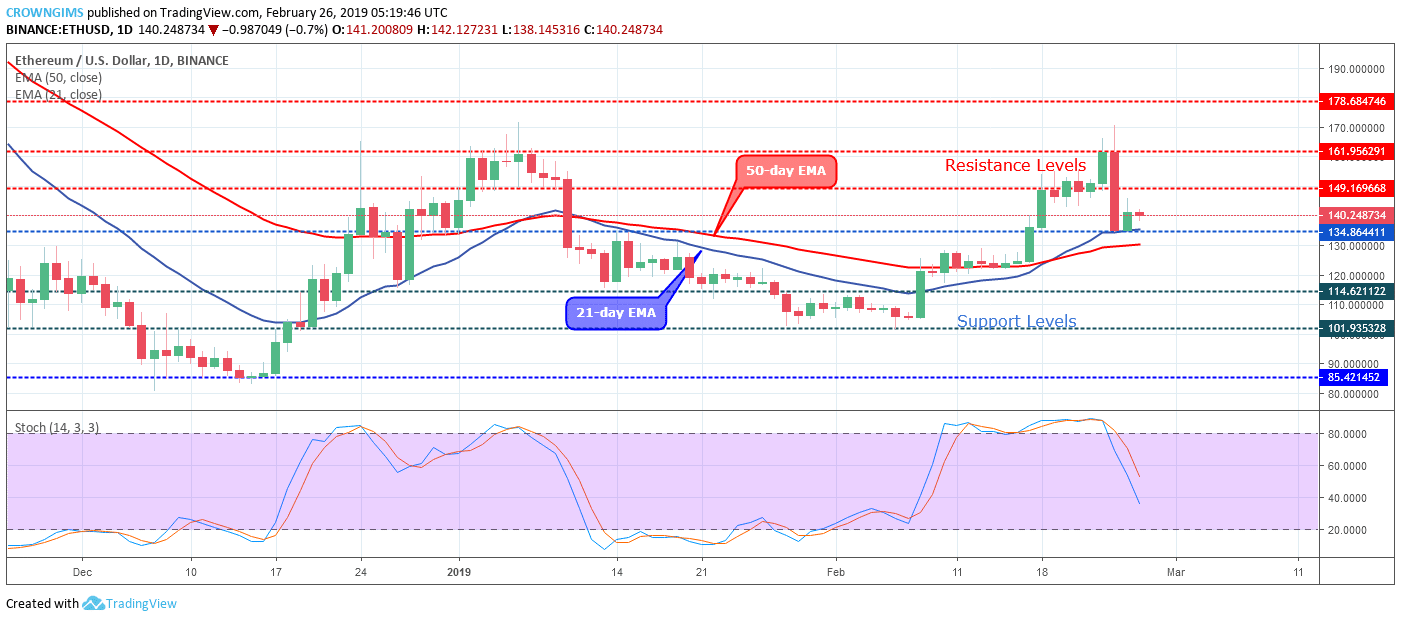
ETH/USD Long-term Trend: Bullish
Supply Zones: $149, $161, $178
Demand Zones: $134, $114, $101On the long-term outlook, ETH/USD is bullish. The Bulls broke up the supply zones of $134 and $149 last week. The bullish momentum pushed Ethereum price to the supply zone of $161 before losing the momentum.
The Bears defended the supply zone of $161 and Ethereum price fell suddenly to $134 demand zone with the formation of strong bearish candle which connotes the presence of the Bears with high momentum. The bears were unable to break down the $134 demand zone and the dynamic support level of 21-day EMA.
The 21-day EMA has crossed the 50-day EMA upside as an indication that the bulls are in control of the ETH market. The cryptocurrency is trading above the two EMAs. The Stochastic Oscillator period 14 is at 40 levels with the signal lines bending towards south which connotes sell signal.
Should the bears increase its pressure, support zone of $134 will be broken and the coin may find its low at $114 – $101, but in case the demand zone of $134 holds, there will be bullish rally of Ethereum price towards the previous high of $161.
ETH/USD Medium-term Trend: Bearish
ETH price is bearish on the medium-term outlook. On 24th of February, the Bulls with its high momentum placed the ETH price above the supply zone of $161. The bearish reversal candle pattern called evening star was formed and the former demand zones of $161, $149 was penetrated down side with the massive bearish candle.
More bearish candles emerged and Ethereum price reached the demand zone of $134. The bulls interrupted the price declination and resulted in to consolidation.
The ETH price is currently placed under the 21-day EMA and the 50-day EMA and the two EMAs are getting closer to each other as a sign of increase in the bearish momentum. The Stochastic Oscillator period 14 is at 20 levels with the signal lines interlocked which connotes that consolidation is ongoing on the 4-Hour chart in the ETH market.
Azeez Mustapha is a specialist in Computer Studies (including DTP), Forex and Crypto trading professional. Being expert technical and currency analyst, as well as experienced fund manager and author of several books, Azeez places strong focus on crypto market studies conducting comprehensive price analyses and sharing forecasts of presumptive market trends.

 On the long-term outlook, ETH/USD is bullish. The Bulls broke up the supply zones of $134 and $149 last week. The bullish momentum pushed Ethereum price to the supply zone of $161 before losing the momentum.
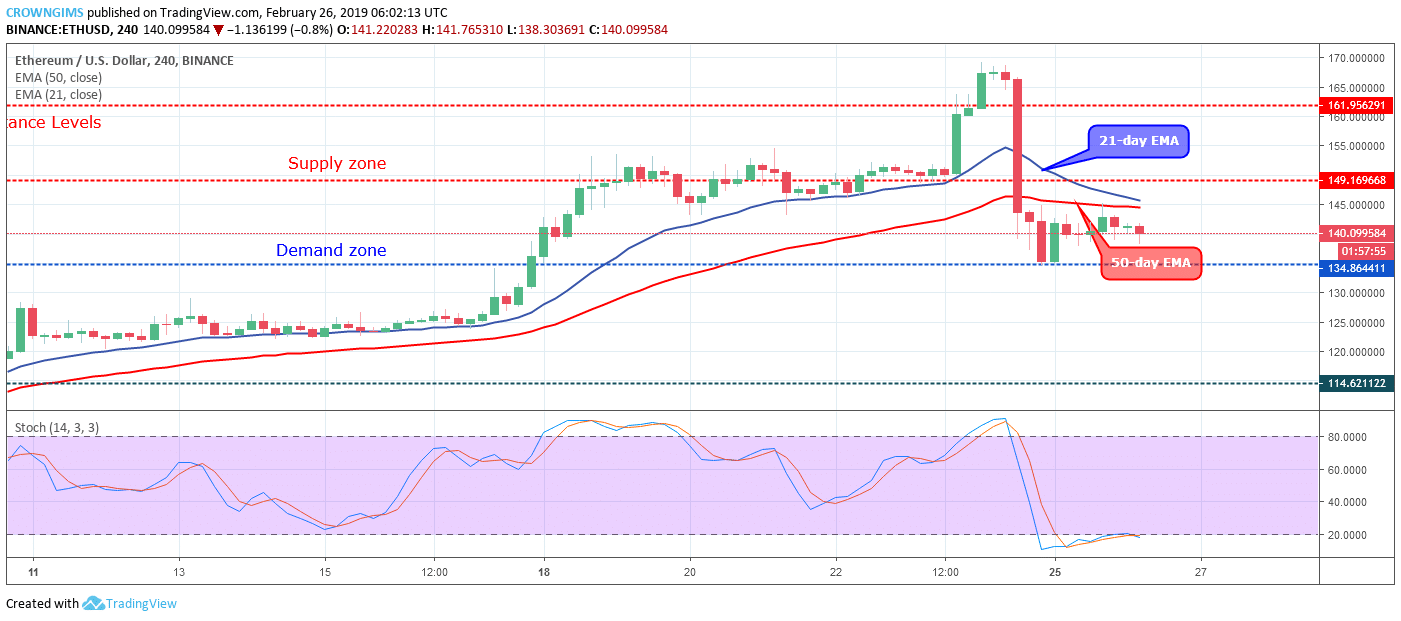 ETH price is bearish on the medium-term outlook. On 24th of February, the Bulls with its high momentum placed the ETH price above the supply zone of $161. The bearish reversal candle pattern called evening star was formed and the former demand zones of $161, $149 was penetrated down side with the massive bearish candle.


