ADA price rose 5.2% as trading volume surged 40%, per CoinMarketCap.
Hoskinson introduced the Cardinal Protocol, enabling Bitcoin DeFi on Cardano.
The Cardinal Protocol may be the fuel needed to spark the ADA price rally.
Cardano ADA$0.2624h volatility:0.3%Market cap:$9.63 BVol. 24h:$372.38 M
has seen a 5.2% price surge as its 24-hour trading volume jumped 40% on June 10, according to CoinMarketCap. This growth came shortly after Cardano founder Charles Hoskinson unveiled the Cardinal Protocol, which is the first Bitcoin DeFi protocol on the Cardano blockchain.
Cardinal allows users to wrap Bitcoin UTXOs (unspent transaction outputs) into DeFi-compatible assets, enabling lending, staking, and borrowing.
Its core feature is the Wrapped UTXO primitive, creating 1:1 pegged assets that can be moved on-chain or with Ordinals, and later burned to release Bitcoin BTC$70 41524h volatility:0.0%Market cap:$1.40 TVol. 24h:$45.56 B
. Cardinal leverages Cardano’s eUTXO model, similar to Bitcoin’s, and utilizes a secure multisig setup (MuSig2) for locking Bitcoin, eliminating traditional custodial risks.
Cardinal integrates BitVMX for verifiable off-chain logic and offers broad Ordinal utility: DeFi yield, collateral, auctions, lending, and more.
Though not yet production-ready, the first Bitcoin Ordinal has been successfully wrapped and unwrapped between Bitcoin and Cardano mainnets. Enhancements are in progress for the 1.0 release, as per the announcement.
We had a first ordinal wrapped/unwrapped on Bitcoin and Cardano mainnets. The protocol works but as mentioned in the paper we don’t consider it production-ready yet. Some improvements are incoming. Stay tuned for 1.0 version 🖖
— Romain Pellerin🇫🇷🇺🇸 (@rom1_pellerin) June 9, 2025
Can ada price hit $1 again?
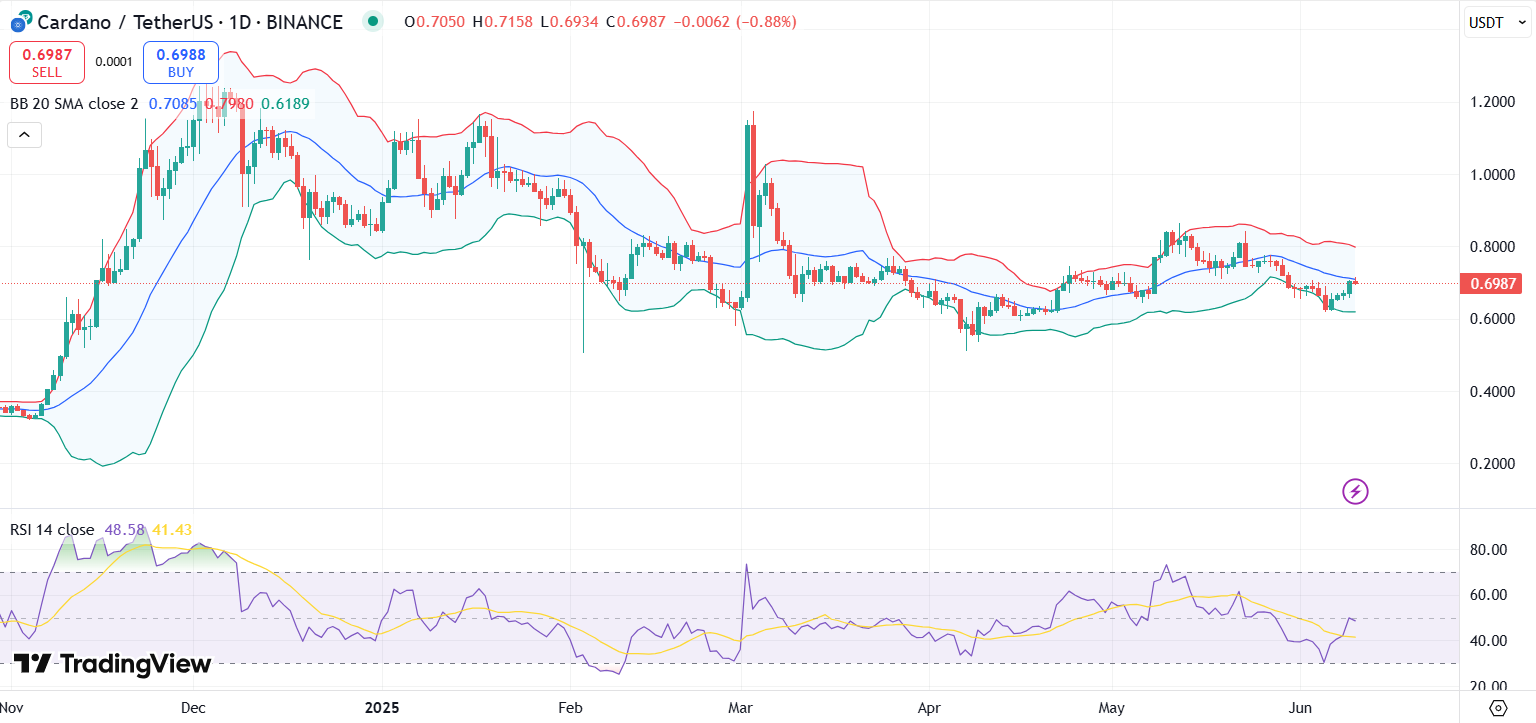
At the time of writing, ADA is trading around $0.698 with a market cap of $24.62 billion. On the daily chart, the RSI sits just below the neutral 50 line, suggesting weak momentum but potential for upside if bulls regain strength.
ADA price chart with RSI and Bollinger Bands | Source: TradingView
Meanwhile, the price is hovering just below the middle Bollinger Band (20-day SMA), currently around $0.7085, indicating a potential reversal zone.
The Bollinger Bands are narrowing, signaling an imminent breakout. A sustained break above the midline could lead the cryptocurrency to test $0.77 resistance.
Disclaimer: Coinspeaker is committed to providing unbiased and transparent reporting. This article aims to deliver accurate and timely information but should not be taken as financial or investment advice. Since market conditions can change rapidly, we encourage you to verify information on your own and consult with a professional before making any decisions based on this content.
A crypto journalist with over 5 years of experience in the industry, Parth has worked with major media outlets in the crypto and finance world, gathering experience and expertise in the space after surviving bear and bull markets over the years. Parth is also an author of 4 self-published books.