Monero (XMR) Price Analysis: Trends of September 19–25, 2018
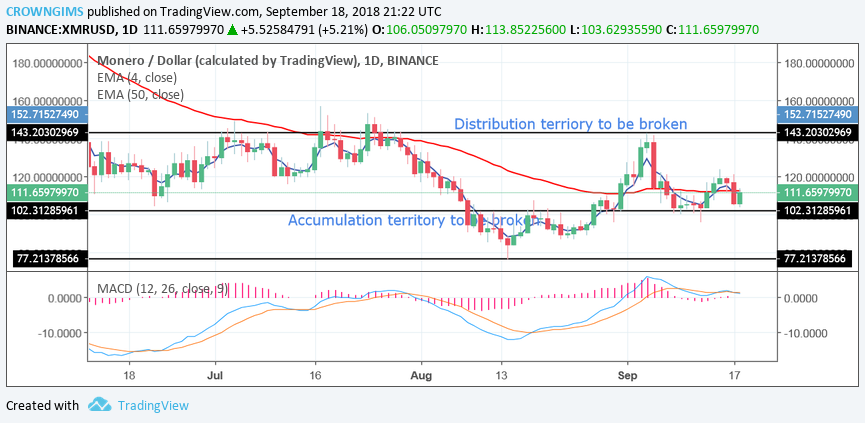
The price continues its ranging within the territories of $150 and $102. Traders can look out to initiate a long trade at the lower level of price in case of the price fall to the lower level of the price range.
Distribution Territories: $150, $178, $206
Accumulation Territories: $102, $77, $45The cryptocurrency resumed its range bound movement last two weeks between the distribution territories of $150 and accumulation territory of $102. On August 14th, the coin reached its low at the lower accumulation territory of $77 and commenced a bullish movement. On September 4th, the price reached the upper level of the price range at $150 and was unable to break the distribution level of $150 due to the formation of a bearish pin bar. The price rejection led to the downward movement with the formation of a strong bearish candle. It made the price to fell to the low level of the price range at $102.
The price continues its ranging within the territories of $150 and $102. The 4-day EMA interlocked the 50-day EMA on the daily chart with the price consolidating below both 4-day EMA and 50 – day EMA.
Currently, the price has tested the accumulation level of $102, a bullish retracement is possible. Since the upper level of the price was not broken, that should have been an opportunity to initiate a short trade. Therefore, traders can look out to initiate a long trade at a lower level of price in case of the price fall to the lower level of the price range.
Should the strong accumulation level of $102 get broken, the pair will experience further downward movement and get exposed to another accumulation level at $77.
The MACD with its histogram at the zero level and the signal lines interlocked at zero level indicates that the price is consolidating at the accumulation territories of $102. Traders should watch out for the breakout and take a position.
XMR/USD Price Medium-term Trend: Bearish
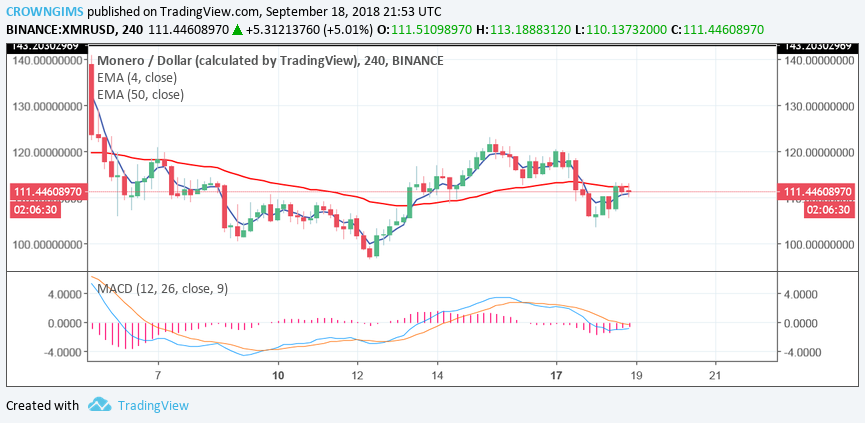
On the 4-Hour chart, the coin is in a downward trend. The price fell after the formation of a bearish engulfing bar at the distribution territories of $150 last two weeks. More strong bearish candles were formed and the price has been trending downward. The price is moving towards the north with 10-day EMA below the price and 50-day EMA, which indicates that there is a probability for the price to resume bullish movement this week. Should the coin breaks the lower distribution level of $77 further downtrend movement could be experienced. However, MACD is below zero with its signal lines pointing upward suggesting that the bulls may take control of the market this week.
Azeez Mustapha is a specialist in Computer Studies (including DTP), Forex and Crypto trading professional. Being expert technical and currency analyst, as well as experienced fund manager and author of several books, Azeez places strong focus on crypto market studies conducting comprehensive price analyses and sharing forecasts of presumptive market trends.

 The
The