Stellar Price Analysis: XLM/USD Trends of December 27–January 02, 2019
The first candle formed at the opening of the market on the daily chart is bearish, broken the supply level of $0.12 downside indicating a probability that Stellar will resume its bearish trend which may have its support at the previous low of $0.09.
By Azeez Mustapha
Updated
2 mins readPhoto: Shutterstock
Supply levels: $0.12, $0.13, $0.15
Demand levels: $0.10, $0.09 $0.06On the long-term outlook, Stellar price is on the ranging trend. On December 20, XLM price risen above $0.12 price level with a strong bullish candle but unable to break up the dynamic resistance level of 21-day EMA. After that, XLM price enters equilibrium state; a scenario whereby neither the bulls nor the bears could push the XLM prices neither up nor push it down respectively. Stellar price started consolidating within the range of $0.13 and $0.12 price level throughout last week.
The first candle formed at the opening of the market on the daily chart is bearish, broken the supply level of $0.12 downside indicates that there is a probability that the coin will resume its bearish trend which may have its support at the previous low of $0.09.
The XLM price is hovering over the 21-day EMA within the range level while 25-day EMA is above the price. The two EMAs are horizontally placed without direction indicating that consolidation is ongoing. The Relative Strength Index (RSI) is bending towards 40 levels which connotes sell signal.
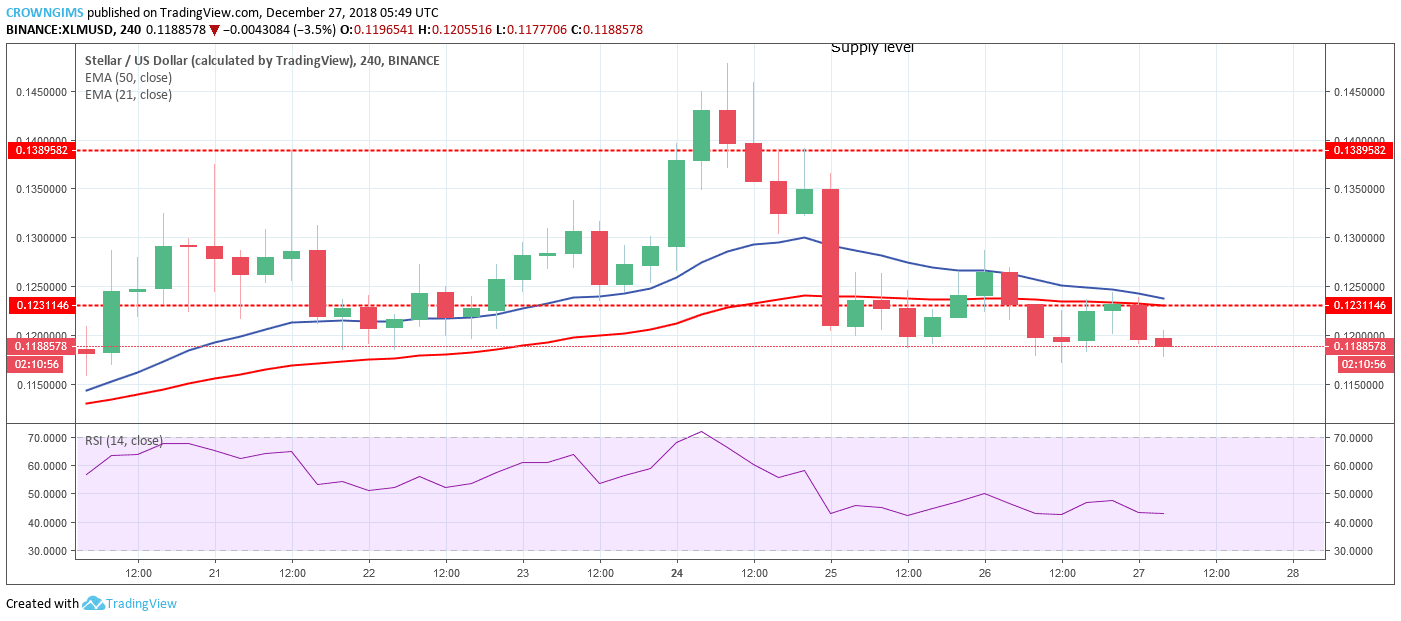
XLM/USD Price Medium-term Trend: Ranging
XLM is in a ranging trend on the medium-term outlook. Stellar price received a bullish push up to $0.14 price level and the bears defended the level and formed a dark cloud cover candle pattern on December 24; which is a bearish reversal candle pattern which pushed the coin down below $0.12. The price level of $0.13 and $0.12 was broken down and the price is currently exposed to the $0.10 demand level.
The 21-day EMA and 50-day EMA are moving closer to each other with the XLM price hovering over the two EMAs coupled with the RSI period 14 is close to 40 levels horizontally placed showing no direction indicates that the consolidation is ongoing. Persistent Pressure from the bears may push the Stellar price to the previous low.
Azeez Mustapha is a specialist in Computer Studies (including DTP), Forex and Crypto trading professional. Being expert technical and currency analyst, as well as experienced fund manager and author of several books, Azeez places strong focus on crypto market studies conducting comprehensive price analyses and sharing forecasts of presumptive market trends.

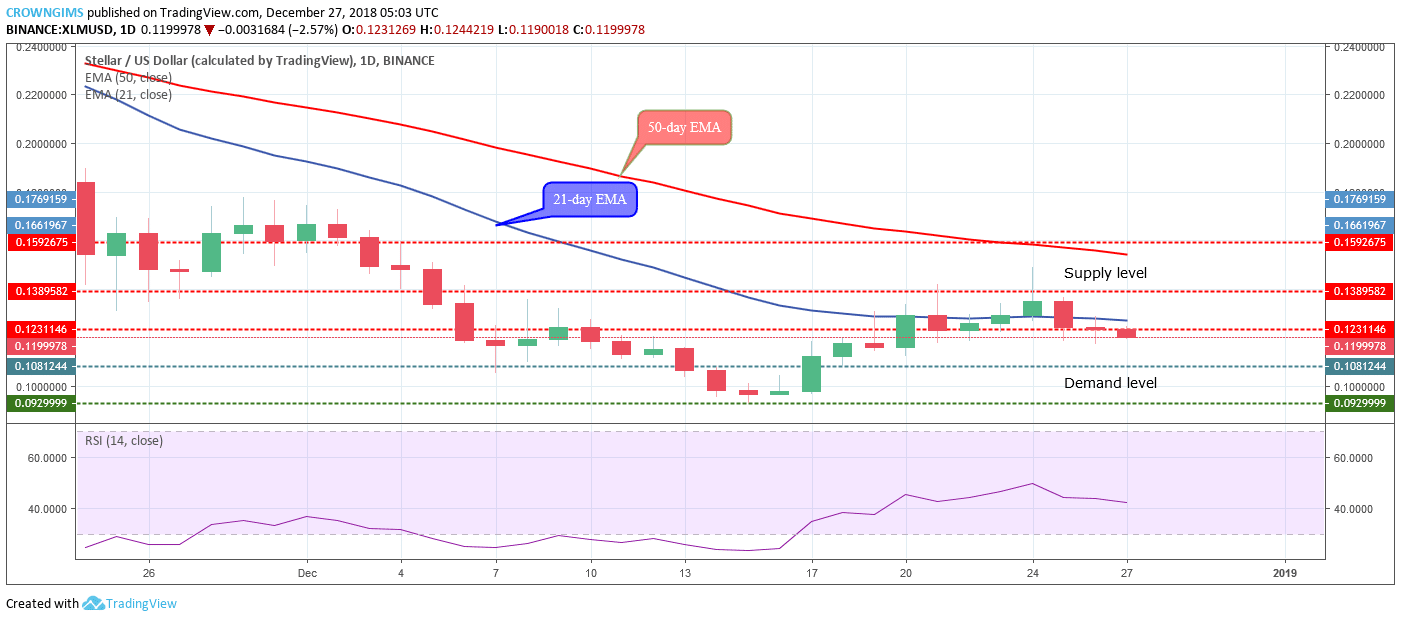 On the long-term outlook, Stellar price is on the ranging trend. On December 20, XLM price risen above $0.12 price level with a strong bullish candle but unable to break up the dynamic resistance level of 21-day EMA. After that, XLM price enters equilibrium state; a scenario whereby neither the bulls nor the bears could push the XLM prices neither up nor push it down respectively. Stellar price started consolidating within the range of $0.13 and $0.12 price level throughout last week.