Stellar Price Analysis: XLM/USD Trends of January 11–17, 2019
Continuation of the bears’ pressure will lead to the penetration of the demand level of $0.10 in which the previous low ($0.09 price level) will be the target of Stellar price. Only when the $0.10 price level hold that will make the coin rally to the north.
By Azeez Mustapha
Updated
2 mins readPhoto: Shutterstock
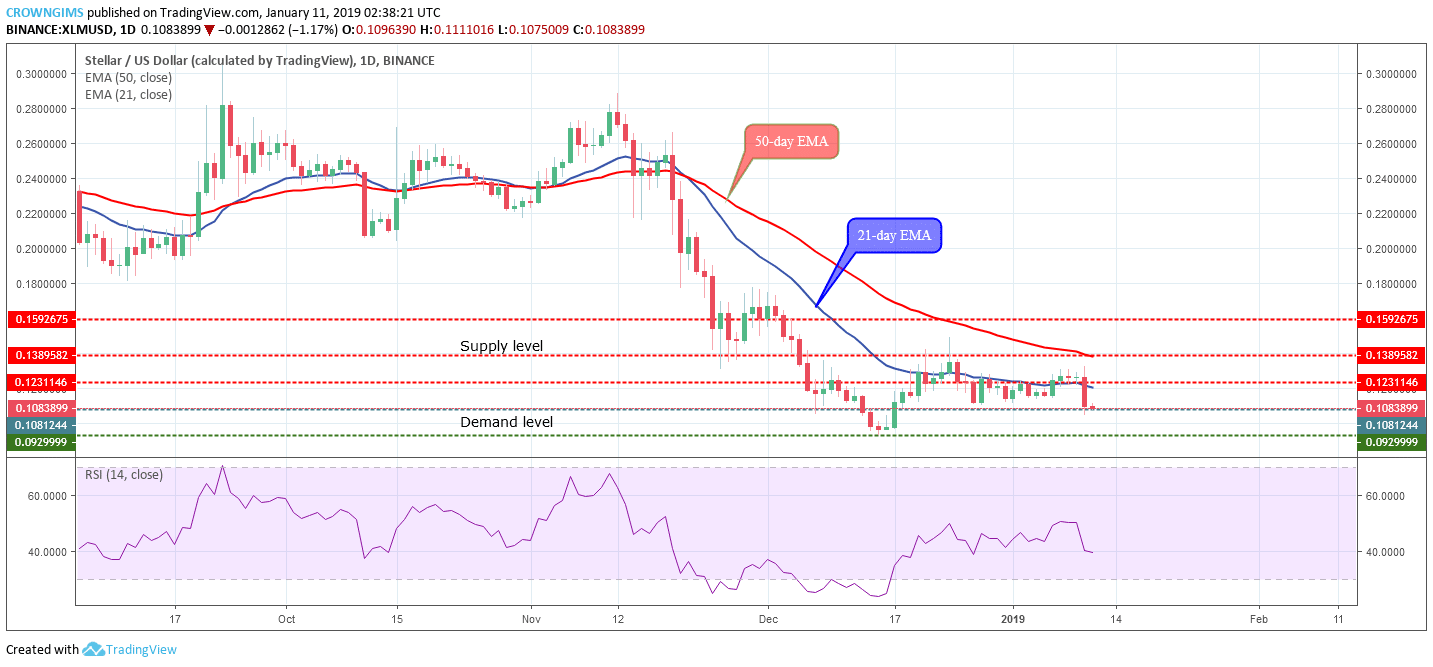
Supply levels: $0.12, $0.13, $0.15
Demand levels: $0.10, $0.09 $0.06Stellar price is bearish on the long-term outlook. The cryptocurrency has been on the sideways movement since December 19 after a bullish rally from the demand level of $0.09. On January 10, the bears exert a pressure on the XLM market with the formation of a big bearish candle that broke down the supply level of $0.12 to the demand level of $0.10. The first candle formed at the opening of the market today is bearish at the demand level of $0.10.
Continuation of the bears’ pressure will lead to the penetration of the demand level of $0.10 in which the previous low ($0.09 price level) will be the target of XLM price. Only when the $0.10 price level hold that will make the coin rally to the north. Stellar price is currently trading below the 21-day EMA and 50-day EMA with the two EMAs bending down which indicates the bearish pressure in the XLM market. Meanwhile, the Relative Strength Index is at 40 levels and its signal line pointing down which connotes sell signal.
XLM/USD Price Medium-term Trend: Bearish
XLM is on its bearish trend on the medium-term outlook. The ranging movement was terminated by the bullish momentum that broke up the supply level of $0.12 with the formation of a strong bullish candle and the Stellar price rallied towards $0.13 price level. Continuation of an uptrend movement was rejected by the bears with the formation of a bearish engulfing candle which returned the coin to its previous low and broke down the $0.10 price level.
The 21-day EMA has crossed the 50-day EMA downside as evidence of a bearish trend and the XLM price is trading below the two EMAs. More bearish candles are emerging and the coin has penetrated the demand level of $0.10 exposing the demand level of $0.09. The Relative Strength Index period 14 is below 30 levels pointing down indicates further declination of XLM price (sell signal).
Azeez Mustapha is a specialist in Computer Studies (including DTP), Forex and Crypto trading professional. Being expert technical and currency analyst, as well as experienced fund manager and author of several books, Azeez places strong focus on crypto market studies conducting comprehensive price analyses and sharing forecasts of presumptive market trends.

 Stellar price is bearish on the long-term outlook. The cryptocurrency has been on the sideways movement since December 19 after a bullish rally from the demand level of $0.09. On January 10, the bears exert a pressure on the XLM market with the formation of a big bearish candle that broke down the supply level of $0.12 to the demand level of $0.10. The first candle formed at the opening of the market today is bearish at the demand level of $0.10.
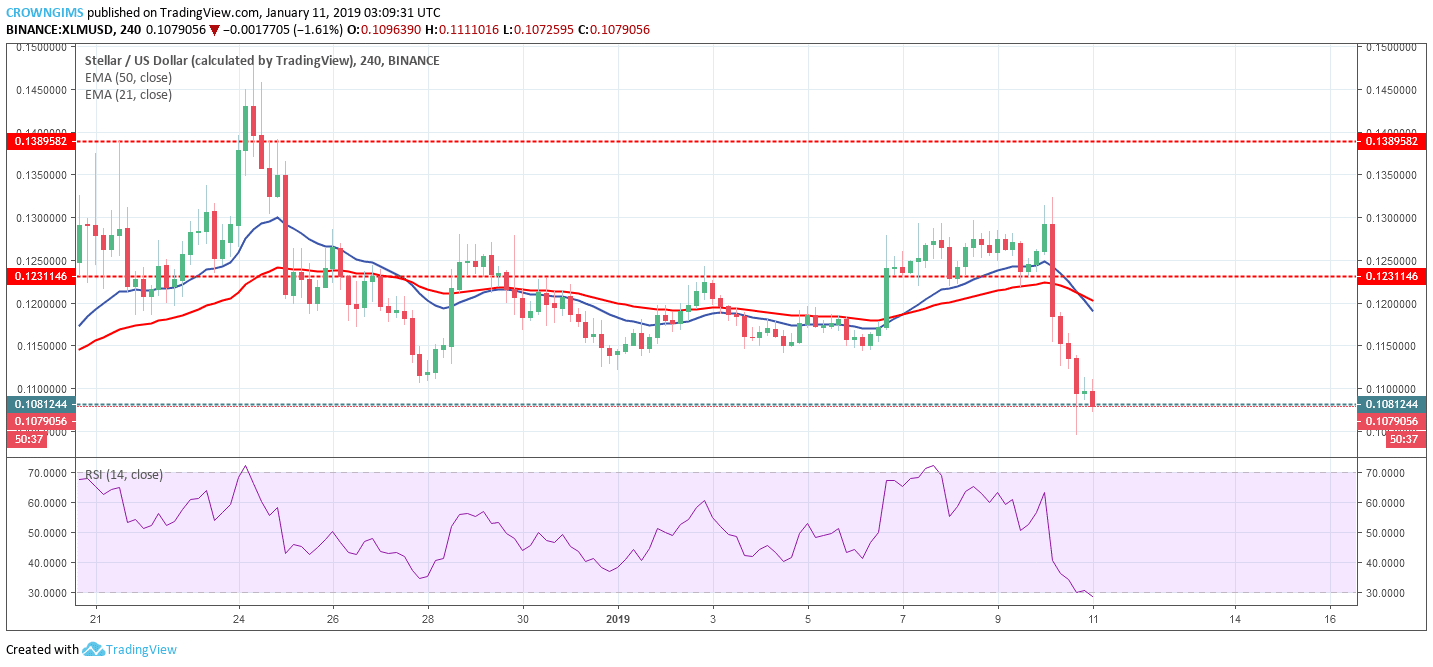 XLM is on its bearish trend on the medium-term outlook. The ranging movement was terminated by the bullish momentum that broke up the supply level of $0.12 with the formation of a strong bullish candle and the Stellar price rallied towards $0.13 price level. Continuation of an uptrend movement was rejected by the bears with the formation of a bearish engulfing candle which returned the coin to its previous low and broke down the $0.10 price level.