Stellar Price Analysis: XLM/USD Trends of January 17–23, 2019
In case the bears exert more pressure on the Stellar price and the demand level of $0.10 does not hold the coin will fall and may have its support at $0.09 – $0.06.
By Azeez Mustapha
Updated
2 mins readPhoto: Shutterstock
Key Highlights:
Stellar price is consolidating at $0.10 price level;
the coin is trading below the two EMAs;
the bears may still hold the XLM market.
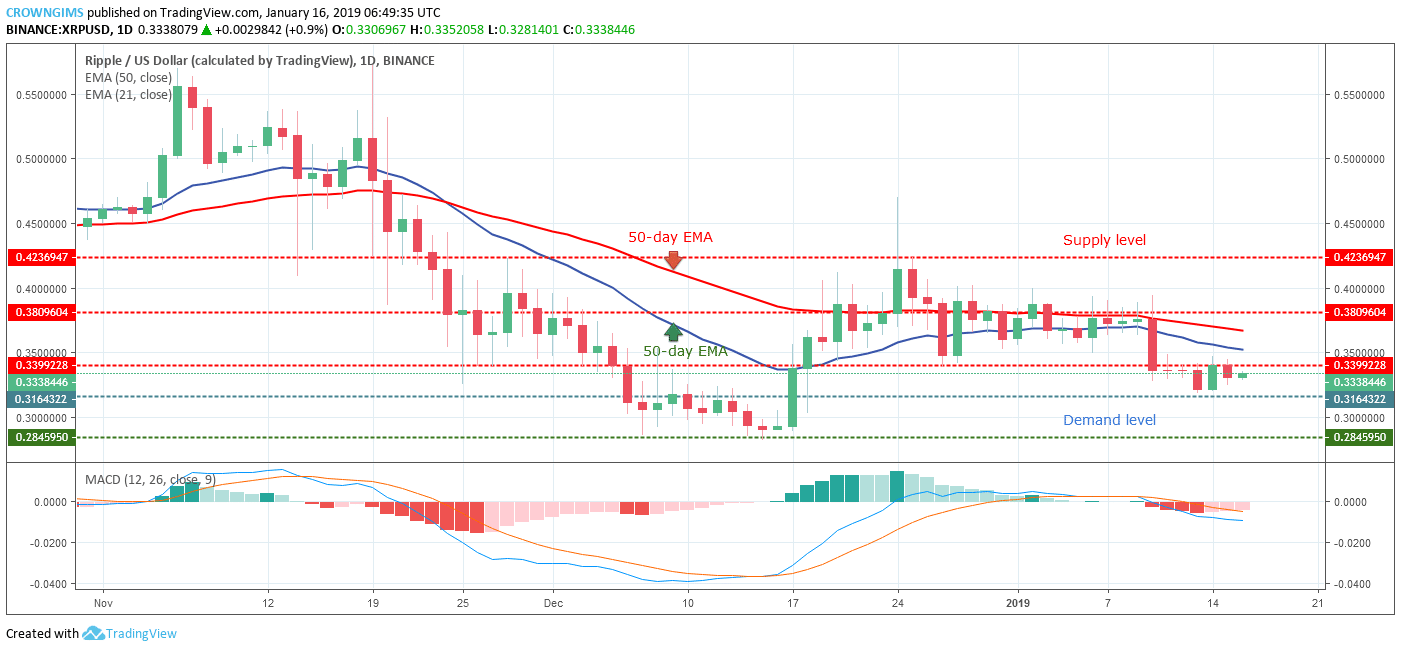
XLM/USD price Long-term Trend: Ranging
Supply levels: $0.12, $0.13, $0.15
Demand levels: $0.10, $0.09 $0.06Stellar price is in a ranging movement on the daily chart. The bearish pressure weakened as the coin approached the $0.10 price level and it has no momentum to break down the level. Likewise, the bulls have no pressure to push the cryptos up. The consolidation commenced when the price reached the $0.1 price level. Although the XLM is under the two EMAs as a sign of bearish trend last week movement was on the same price level.
Should the bulls defend the demand level of $0.13 and the price bounces the Stellar price will rally towards $0.12 supply level which may have its target at $0.13 – $0.15. In case the bears exert more pressure on the XLM price and the demand level of $0.10 does not hold the coin will fall and may have its support at $0.09 – $0.06. Stellar price is under the 21-day EMA and the 50-day EMA and the Stochastic Oscillator period 14 is at the oversold level below 20 levels and the signal lines point down indicates that the XLM price may fall further.
XLM/USD Price Medium-term Trend: Bearish
XLM/USD is still on its bearish trend on the medium-term outlook. XLM price bottomed at $0.10 on January 11 and there was a consolidation for many hours before the bulls gather momentum and pushed it up to penetrate the 21-day EMA but resisted by the 50-day EMA. Stellar price declined towards $0.09 mark after broken down the demand level of $0.10. The XLM price is currently below $0.10 with more bearish candles formed since the opening of today’s market which indicates an increase in bear’s pressure.
The 50-day EMA remains above the 21-day EMA with the coin trading below the two EMAs as an indication of bears’ momentum in the XLM market. The stochastic Oscillator period 14 is below 40 levels with signal lines point to the south indicate sell signal.
Azeez Mustapha is a specialist in Computer Studies (including DTP), Forex and Crypto trading professional. Being expert technical and currency analyst, as well as experienced fund manager and author of several books, Azeez places strong focus on crypto market studies conducting comprehensive price analyses and sharing forecasts of presumptive market trends.

 Stellar price is in a ranging movement on the daily chart. The bearish pressure weakened as the coin approached the $0.10 price level and it has no momentum to break down the level. Likewise, the bulls have no pressure to push the cryptos up. The consolidation commenced when the price reached the $0.1 price level. Although the XLM is under the two EMAs as a sign of bearish trend last week movement was on the same price level.
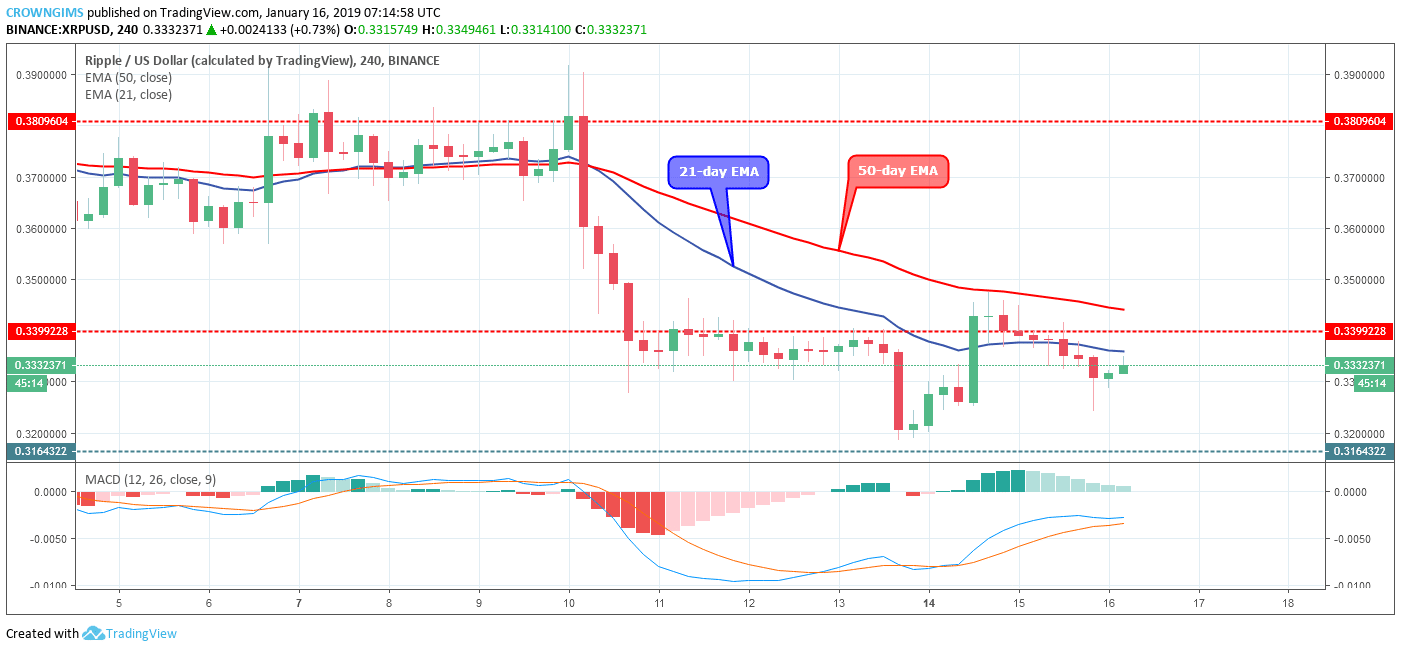 XLM/USD is still on its bearish trend on the medium-term outlook. XLM price bottomed at $0.10 on January 11 and there was a consolidation for many hours before the bulls gather momentum and pushed it up to penetrate the 21-day EMA but resisted by the 50-day EMA. Stellar price declined towards $0.09 mark after broken down the demand level of $0.10. The XLM price is currently below $0.10 with more bearish candles formed since the opening of today’s market which indicates an increase in bear’s pressure.