Stellar Price Analysis: XLM/USD Trends of November 08-14, 2018
Should the bears continue with their increased momentum the Stellar price would break the demand level of $0.23 and expose to the demand level of $0.22.
By Azeez Mustapha
Updated
3 mins readPhoto: QuoteInspector
XLM price may bounce from the demand level of $0.23;
traders can look for an opportunity to place a long trade.
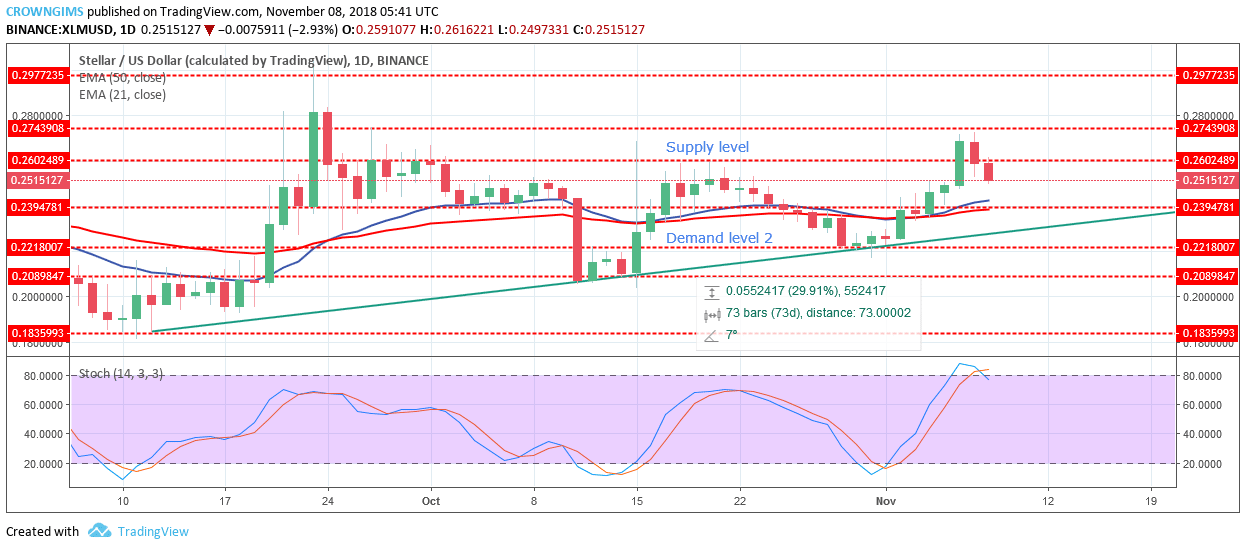
XLM/USD Price Long-term Trend: Bullish
Supply levels: $0.26, $0.27, $0.29
Demand levels: $0.23, $0.22, $0.20Stellar resume its bullish trend last week on its long-term outlook. The bulls’ return was noticed after the formation of a hammer candle at $0.22 support level. Confirmation to the bulls’ take over was clearly seen as the next daily candle closed as bullish engulfing candle above the dynamic support and resistance (21-day and 50-day EMAs). Increased Bull’s pressure led to the breakup of former supply level of $0.23 and supply level of $0.26 last week. Continuation of XLM price increase was rejected at the supply level of $0.27as the inside bar bearish candle formed that broke the resistance level of $0.26 downside.
XLM price is currently trading below the supply level of $0.26 heading toward the demand level of $0.23. XLM price is above 21-day EMA and the 50-day EMA which indicates the bullish trend is ongoing. Meanwhile, the Stochastic Oscillator period 14 is above 80 levels (oversold region) with its signal lines pointing to the south which indicates a selling signal.
Should the bears continue with their increased momentum the price would break the demand level of $0.23 and expose to the demand level of $0.22. On the other hand, in case the demand zone of $0.23 hold and the XLM price bounce to the north, the trader can look for an opportunity to place buy limit order at this level so as to take long trading and place the stop loss below the demand zone of $0.23.
XLM/USD Price Medium-term Trend: Bullish
Stellar price increased steadily last week as the bulls took over the XLM market after the formation of bullish pin bar candle on the dynamic support and resistance (21-day and 50-day EMA) followed by strong bullish candle above the two EMAs. The coin broke the former supply levels of $0.23 and $0.26 upside before it was interrupted by the bears at the supply level of $0.27.
Currently, XLM price has broken downside the supply level of $0.26 exposed to demand level of $0.23. Stellar is between 21-day EMA and 50-day EMA as the sign of bearish market and the Stochastic Oscillator period 14 is at 40 levels with its signal lines point down indicates sell signal.
Azeez Mustapha is a specialist in Computer Studies (including DTP), Forex and Crypto trading professional. Being expert technical and currency analyst, as well as experienced fund manager and author of several books, Azeez places strong focus on crypto market studies conducting comprehensive price analyses and sharing forecasts of presumptive market trends.

 Stellar resume its bullish trend last week on its long-term outlook. The bulls’ return was noticed after the formation of a hammer candle at $0.22 support level. Confirmation to the bulls’ take over was clearly seen as the next daily candle closed as bullish engulfing candle above the dynamic support and resistance (21-day and 50-day EMAs). Increased Bull’s pressure led to the breakup of former supply level of $0.23 and supply level of $0.26 last week. Continuation of XLM price increase was rejected at the supply level of $0.27as the inside bar bearish candle formed that broke the resistance level of $0.26 downside.
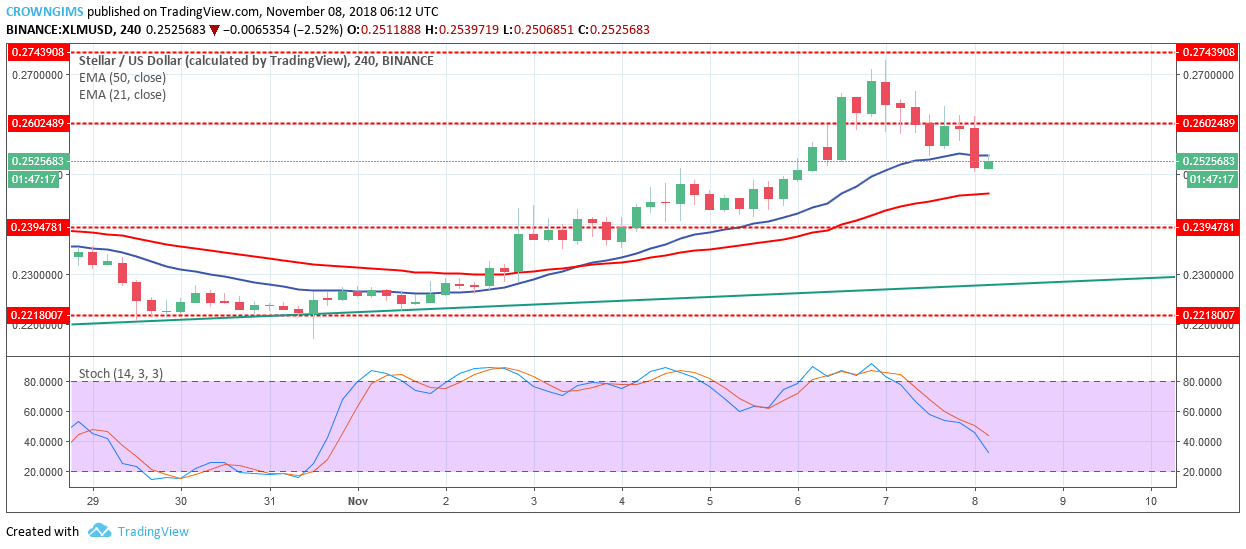 Stellar price increased steadily last week as the bulls took over the XLM market after the formation of bullish pin bar candle on the dynamic support and resistance (21-day and 50-day EMA) followed by strong bullish candle above the two EMAs. The coin broke the former supply levels of $0.23 and $0.26 upside before it was interrupted by the bears at the supply level of $0.27.