Tron (TRX) Price Analysis: Trends of October 2–8, 2018
There is a probability for the uptrend movement this week in case the price breakout to the north from the ascending triangle pattern formed on both daily and 4-Hour charts.
By Azeez Mustapha
Updated
2 mins readPhoto: Shutterstock
Key Highlights:
Confirmation of “Ascending triangle” pattern on both daily and 4-Hour charts;
there is a tendency for the price increase;
in case bears increase their pressure price will break out to the south.
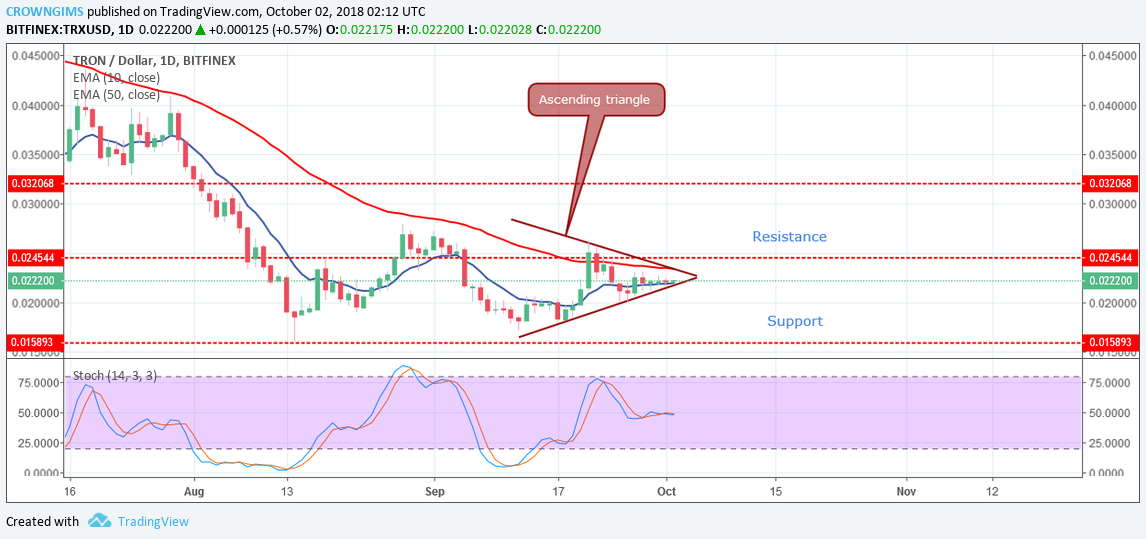
TRX/USD Long-term Trend: Ranging
Resistance levels: $0.024, $0.031, $0.041
Support levels: $0.015, $0.010, $0.05TRX/USD was in a side way trend last week. The price has fallen into the previous range bound zone. The cryptocurrency fluctuates between the resistance levels of $0.024 and the support levels of $0.015. The coin started its sideways trend immediately it moved up on September 21, towards the resistance levels of $0.024 with the formation of bullish inside bar candle at the support level of $0.010 and the buyers were unable to push the price higher above the resistance level of $0.024. The price fell towards the support level of $0.015.
Currently, the price is in between 10-day EMA and 50-day EMA inside the “Ascending triangle” pattern. There is a probability for a breakout of the price from the ascending triangle towards the north this week. In case bears put in more pressure, the break out may occur at the lower trend line of the ascending triangle and the support level of $0.015 may not hold, which may lead to further downtrend.
The Stochastic Oscillator Period 14 on the daily chart is on the level 50 with the signal lines interlocked to each other with no direction, indicating that price may break out at any moment this week.
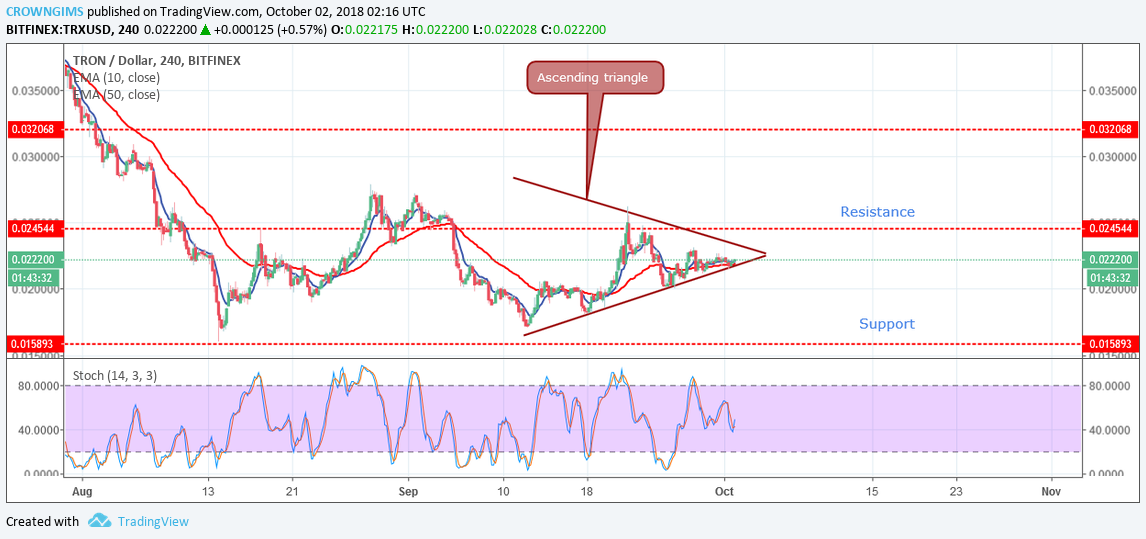
TRX/USD Price Medium-term Trend: Ranging
On the 4-Hour chart, the price is on the sideways trend. There was not enough momentum for both buyers and the sellers to break the resistance upward and support downward respectively. The price is consolidating within the “ascending triangle” pattern, which indicates the probability of bullish price break out.
The 10-day EMA crossed the 50-day EMA upside with the price on the 10-day EMA; it indicates that there could be an uptrend movement that will break the upper trend line of the ascending triangle and the price will move towards the resistance level of $0.024.
Should bears increase their momentum there is a probability that the price will experience downtrend movement towards the support level of $0.05. Nevertheless, the Stochastic Oscillator Period 14 is on the 50 levels, with the signal lines directed towards the north indicate a buy signal.
Azeez Mustapha is a specialist in Computer Studies (including DTP), Forex and Crypto trading professional. Being expert technical and currency analyst, as well as experienced fund manager and author of several books, Azeez places strong focus on crypto market studies conducting comprehensive price analyses and sharing forecasts of presumptive market trends.

 On the 4-Hour chart, the price is on the sideways trend. There was not enough momentum for both buyers and the sellers to break the resistance upward and support downward respectively. The price is consolidating within the “ascending triangle” pattern, which indicates the probability of bullish price break out.