Tron (TRX) Price Analysis: Trends of September 11 – 17, 2018
There is a possibility for the coin to move down and test the support level of $0.015, should the bears increase their pressure, the support level of $0.015 may not hold.
the coin may move down and test the support level of $0.015;
In case bears increase their pressure, the support level of $0.015 may not hold;
A radical fundamental event can forcefully bring about a significant rally in the market.
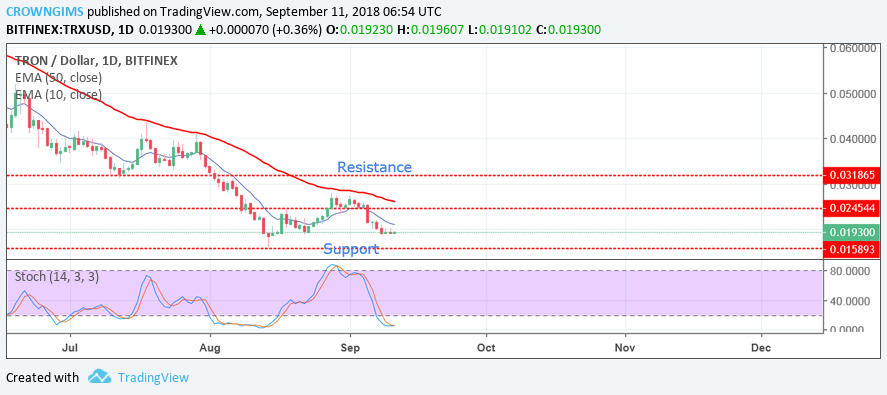
TRX/USD Long-term Trend: Bearish
Resistance levels: $0.024, $0.031, $0.041
Support levels: $0.015, $0.010, $0.05
The buyers of TRX/USD were unable to push the price higher far above the resistance level of $0.024. The price fell due to the bearish pressure towards the support level of $0.015. Some bearish candles were formed which further reduces the price last week. The price is below 10-day EMA and 50-day EMA is above the 10-day EMA. There is a possibility for the coin to move down and test the support level of $0.015 this week. Should bears increase their pressure, the support level of $0.015 may not hold and it may be exposed to another support level of $0.010.
However, there is probability that the price might go up within the next several trading days, by making a break out towards the North at $0.024 as the Stochastic Oscillator Period 14 on the daily chart is below the level 20 with the signal lines pointing towards the North, indicating that there could be a bullish movement this week.
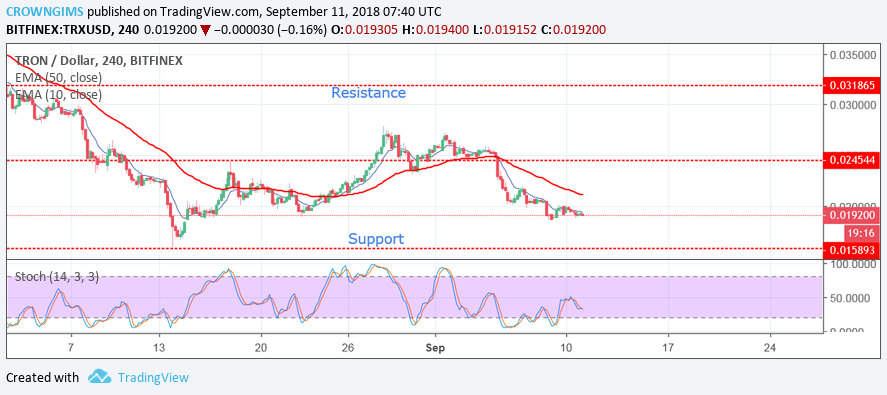
TRX/USD Price Medium-term Trend: Bearish
TRX/USD on the medium term is bearish. The coin broke the last week support level of $0.024 and rallied towards the south and the price was exposed to the support level of $0.015. The 10-day EMA crossed the 50-day EMA downside with the price below 10-day EMA which indicates that there could be a downtrend movement towards the support level of $0.015.
In case more buyers come in this week there is a probability that the price will experience uptrend movement towards the resistance level of $0.024 as the Stochastic Oscillator Period 14 is above 20, with the signal lines directed towards the North. A radical fundamental event can forcefully bring about a significant rally in the market.
Disclaimer: The views and opinions expressed here do not reflect that of Coinspeaker.com and do not constitute financial advice. Always do your own research. The charts for the analysis are provided by TradingView
Azeez Mustapha is a specialist in Computer Studies (including DTP), Forex and Crypto trading professional. Being expert technical and currency analyst, as well as experienced fund manager and author of several books, Azeez places strong focus on crypto market studies conducting comprehensive price analyses and sharing forecasts of presumptive market trends.