
Author
staff writer
With the Fed opting for a steady course, the immediate impact on Bitcoin and other cryptocurrencies was mixed, reflecting the complex interplay between macroeconomic policies and digital asset valuations.
 Edited by Kseniia Klichova
Updated
3 mins read
Edited by Kseniia Klichova
Updated
3 mins read

Bitcoin’s pricing and the broader crypto market experienced significant volatility. With movements that saw Bitcoin (BTC) briefly dip below critical support levels before making a modest recovery and unprecedented activity in the ETF market, there’s much to unpack.
A notable decline marked Bitcoin’s journey this week, briefly falling below the $61,000 mark only to climb back above $63,000. This recovery, however, came at a cost, with nearly $600 million in liquidations. This volatility was not limited to Bitcoin; major tokens also felt the heat, experiencing up to 15% declines.
Ether, the second-largest cryptocurrency by market cap, was not immune to the downturn, dropping below the $3,100 threshold. The possibility of a spot ETH exchange-traded fund (ETF) listing, which had buoyed hopes, saw reduced odds, further dampening sentiment. Other prominent cryptocurrencies like Solana, Avalanche, and Cardano also faced setbacks, with drops of around 8% over the same period.
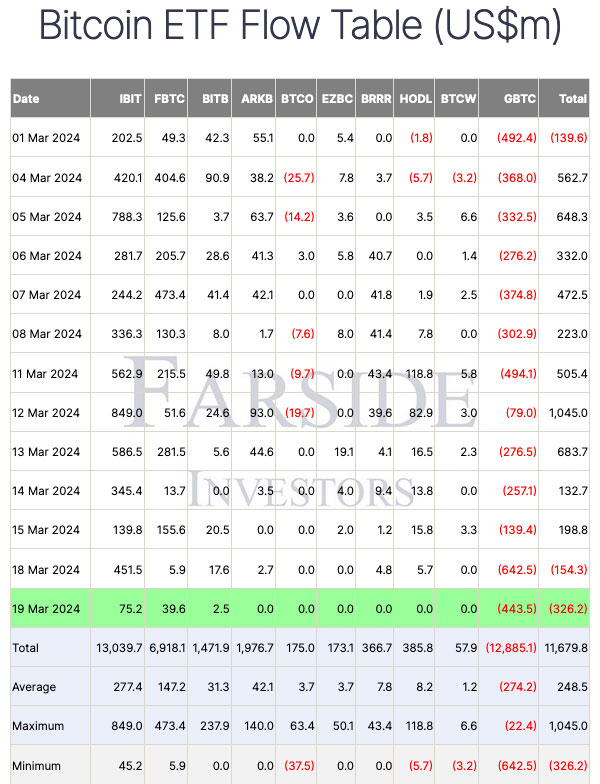
Photo: Farside Investors
The US spot Bitcoin ETFs recorded their largest day of net outflows on record, totaling $326 million. Grayscale’s Bitcoin Trust experienced $443.5 million in net outflows, posing serious questions about its asset management strategy moving forward.
Interestingly, despite the overall outflow, certain ETFs managed to attract investments, albeit modestly. BlackRock, Fidelity, and Bitwise’s ETFs posted net inflows, suggesting a nuanced investor perspective that sees potential amidst the turbulence.
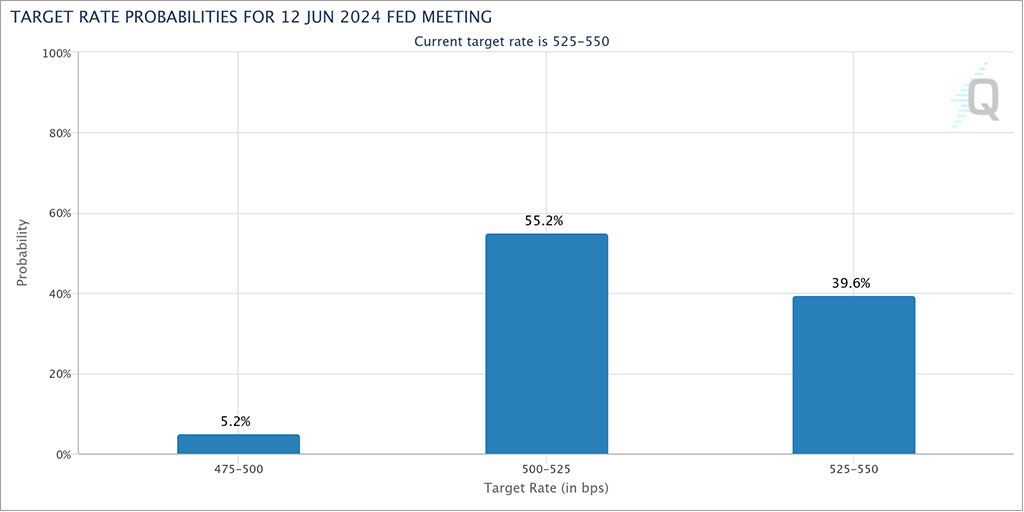
Photo: CME Group
The Federal Reserve’s recent meeting and decisions on interest rates were eagerly anticipated, with potential implications for risk assets like cryptocurrencies. With the Fed opting for a steady course, the immediate impact on Bitcoin and other cryptocurrencies was mixed, reflecting the complex interplay between macroeconomic policies and digital asset valuations.
Looking ahead, the sentiment surrounding Bitcoin and the broader crypto market remains cautiously optimistic, with a keen eye on macroeconomic developments and regulatory decisions. The ETF market, particularly, will be one to watch, as investor behavior here could signal broader trends in adoption and valuation.
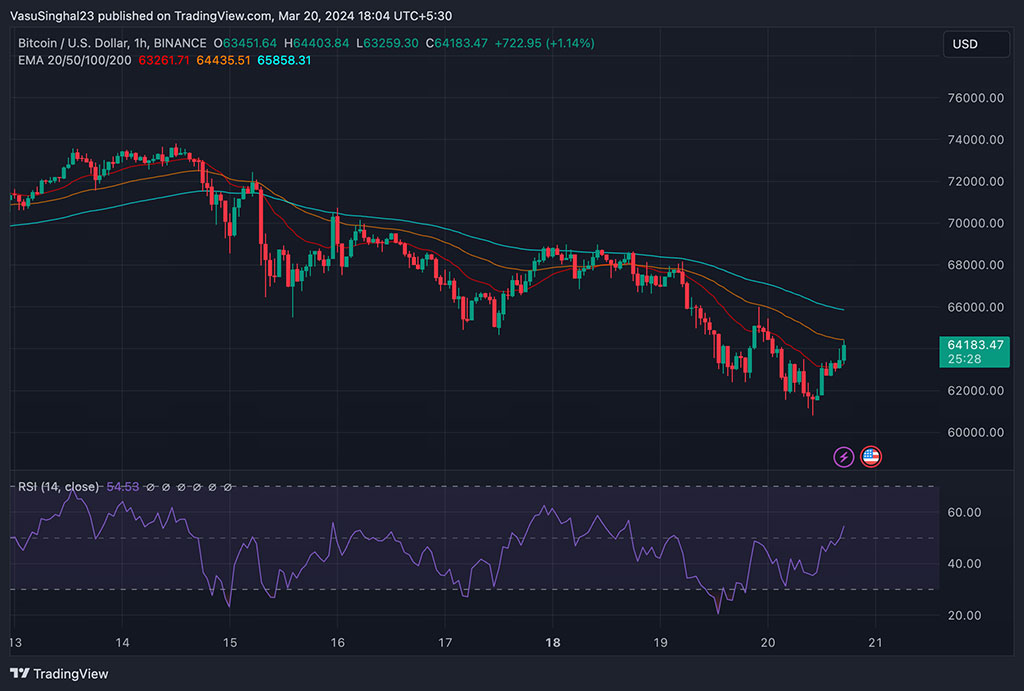
Photo: TradingView
At the time of the last data point, Bitcoin (BTC) is trading at approximately $64,183.47. The price action over the period displayed shows a general downtrend, with the price falling from around the $67,000 level.
The Exponential Moving Averages (EMAs) plotted are the 20, 50, 100, and 200 EMAs, indicated by different colored lines. At the latest price, Bitcoin is trading below all four EMAs, with the 20 EMA acting as the closest resistance level. This positioning suggests a bearish bias in the short term, as the price is below these key EMAs.
Furthermore, the Relative Strength Index (RSI) is plotted at the bottom of the chart. The RSI is a momentum indicator that measures the magnitude of recent price changes to evaluate overbought or oversold conditions. It currently reads at around 54.53, which is relatively neutral. However, it had previously dipped towards the oversold territory below 30 before rebounding, which could indicate a possible momentum shift or a temporary relief in selling pressure.
In summary, the chart indicates that Bitcoin has been in a downtrend in the short term, as evidenced by the price being below all key EMAs. However, the recent RSI reading suggests some stabilization or a potential trend reversal if buyers step in. Traders might look for a sustained move above the closest EMA levels to confirm bullish momentum or seek other indicators and patterns for further trading signals.
Disclaimer: Coinspeaker is committed to providing unbiased and transparent reporting. This article aims to deliver accurate and timely information but should not be taken as financial or investment advice. Since market conditions can change rapidly, we encourage you to verify information on your own and consult with a professional before making any decisions based on this content.


